Why I decided to try
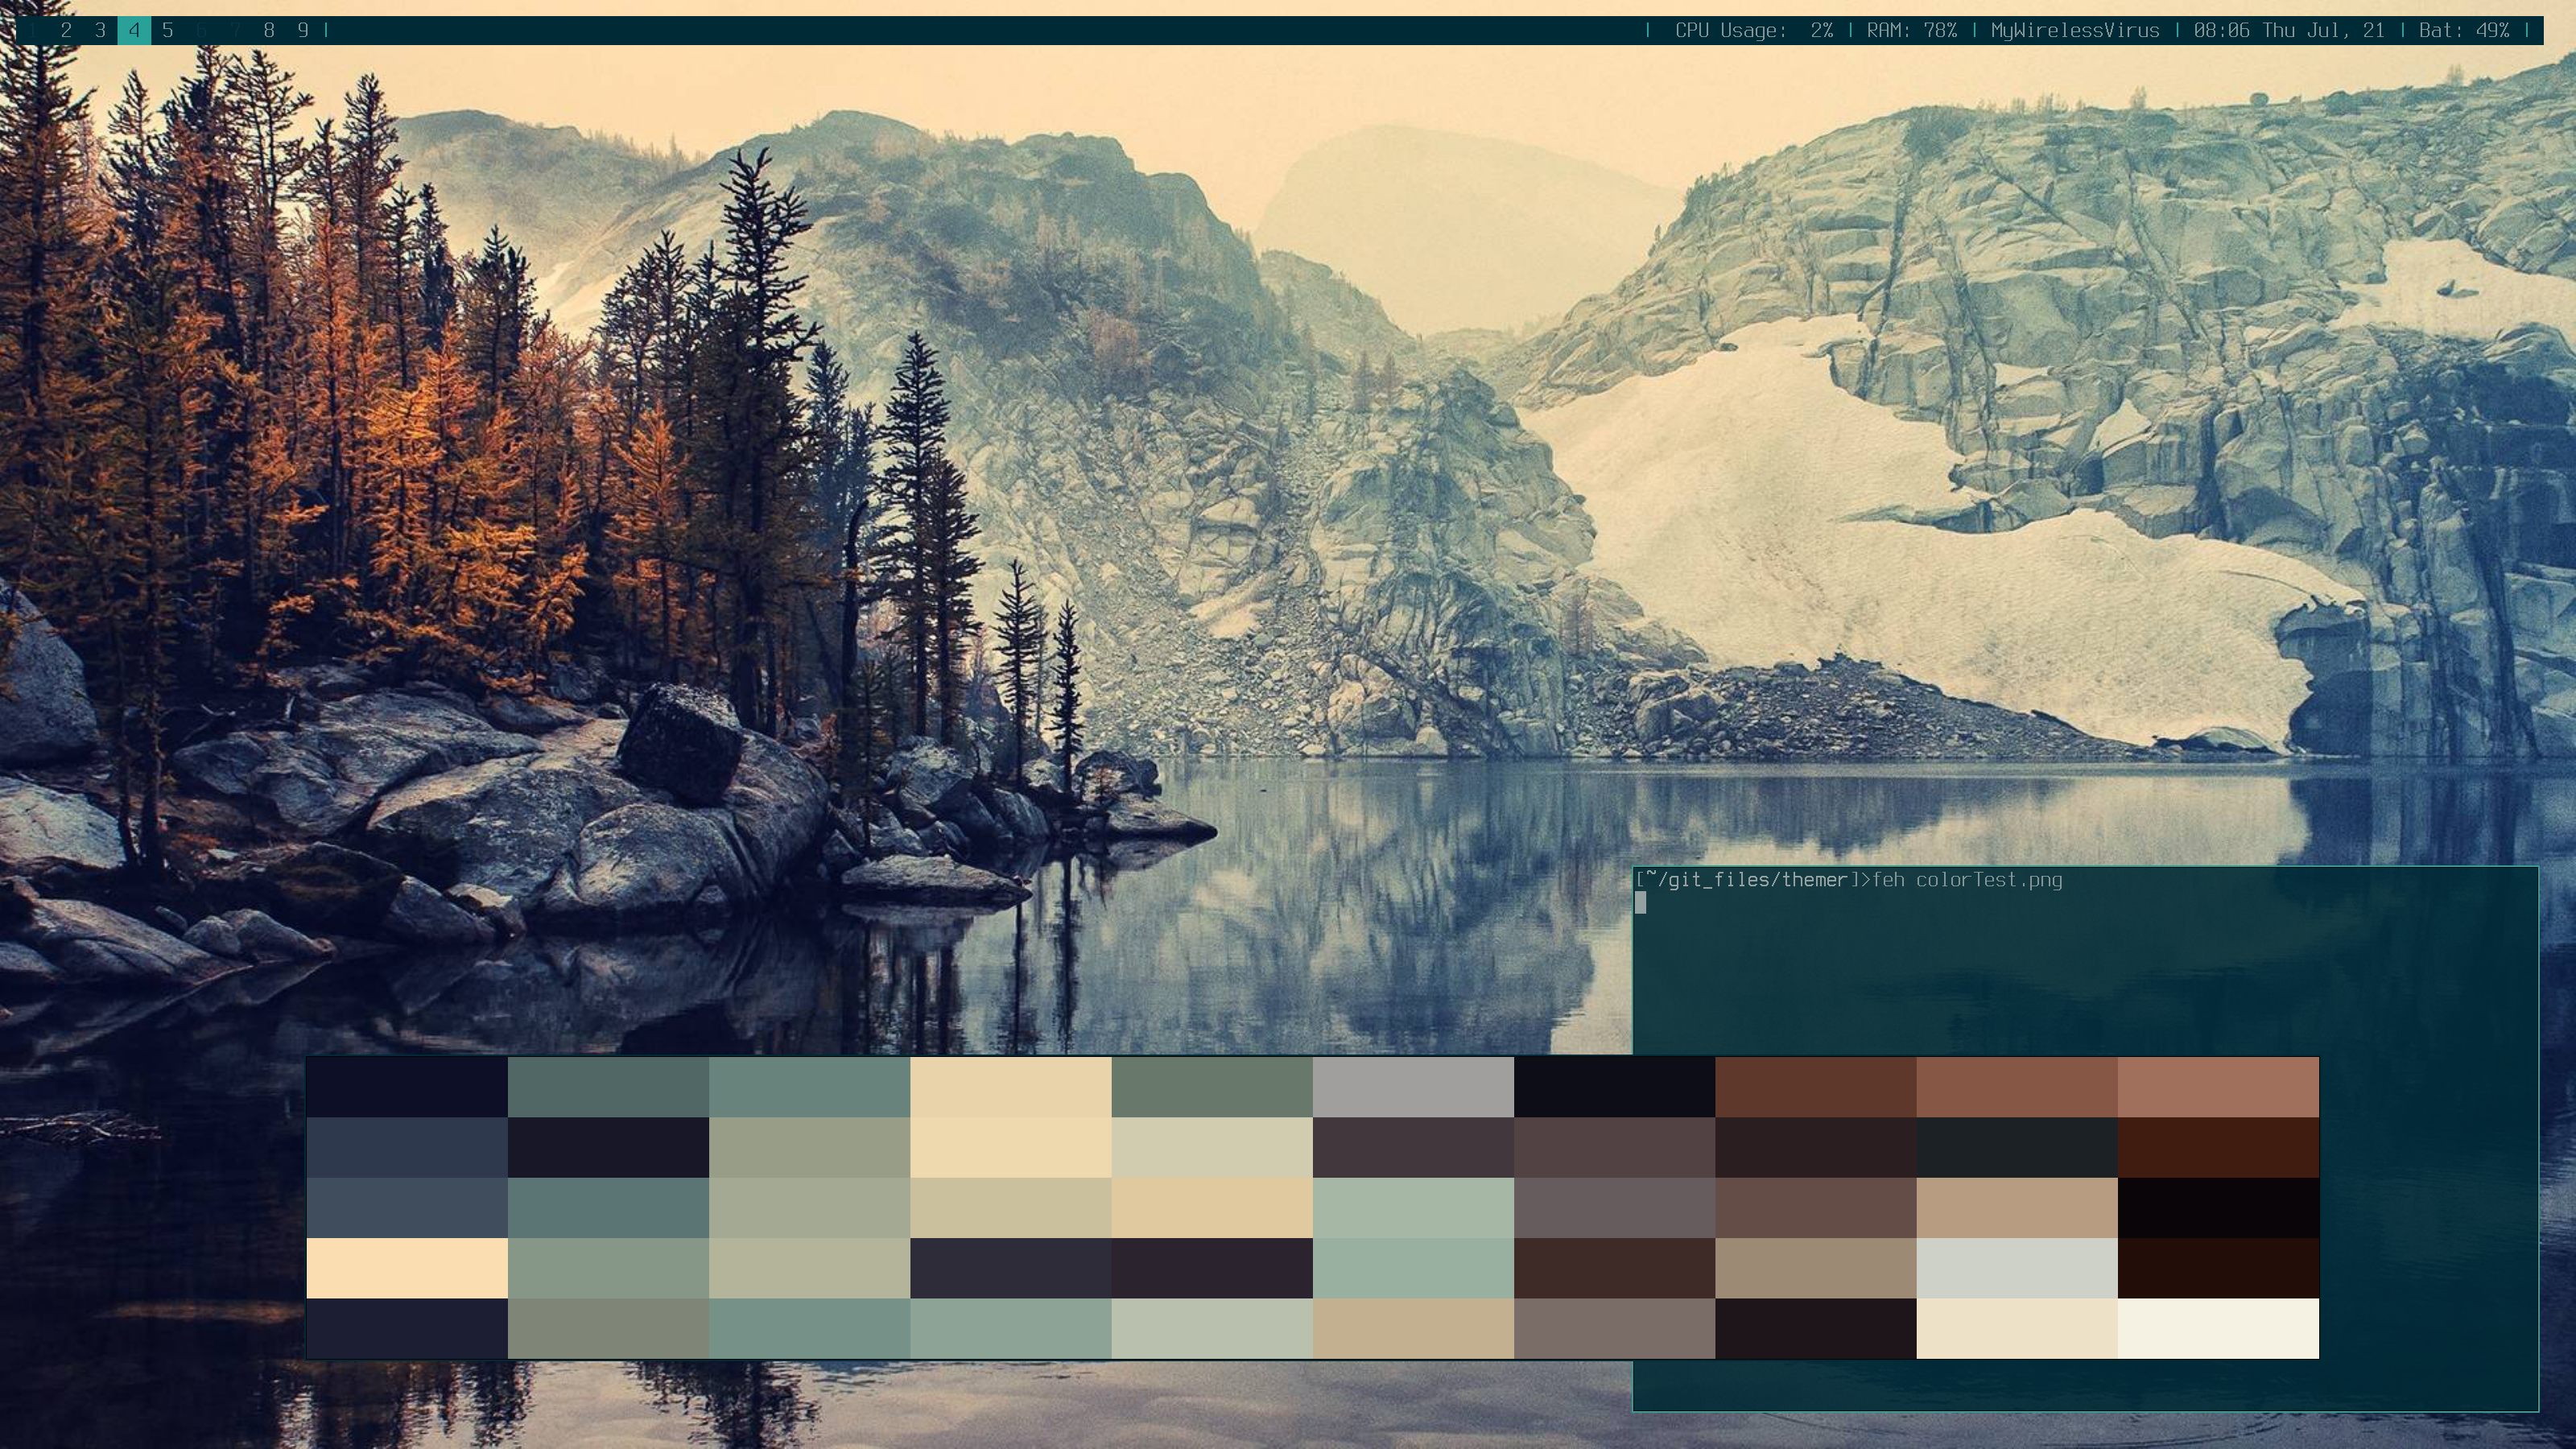
I have liked to theme my Linux window manager for quite some time. I usually choose an image and generate my colors (used for my terminal and bar) from those found in the image. I have been unimpressed with the existing programs that generate colors from images. Some of the programs that I tried were very slow, and others were quite bad at extracting the colors that I wanted from the image. One of the best programs that I found was written in Go, take a look at it here. Schemer2 ran quickly and the output from it was beautiful:
It was exactly what I was looking for, but I quickly found out that it didn’t work every time. After looking at the code I realized that it was just choosing a few random colors that were common. Not the most common, just more common than a threshold. This meant that you could get things like:
which I really did not like because it chose colors that are not very bright or noticeable. After I ran it a bunch more times I finally got colors that I found that we acceptable again.
After finding out that my favorite program only sometimes generated good colors on some images (like above) I decided that I had to come up with a better solution.
My idea
Before I get too far into the thick of it, my code for this project is available for your viewing pleasure.
I have been wanting to play with k-means for quite a while now, but have never had a reason to do it. This was finally my opportunity. It should be pretty easy, right? There were several steps that I had to take to get it working:
- Plot the pixels in Euclidean space.
- Easy, just (R, G, B) became (X, Y, Z). This let me plot the pixels in 3d space so that I could run k-means on them.
- Choose first cluster centers.
- This was also pretty easy, I just chose ‘k’ random points from the set of all points and start from there.
- Assign each point to it’s closest cluster.
- Some information about RGB in Go
- RGB values are 32 bit unsigned instead of 16 bit ints. This is so math on them does not cause overflow details.
- These values are Alpha-premultiplied
- I decided that using int64 for distance calculations would be precise enough to not mess up the colors noticeably and would help speed a lot by not using floating point.
- Some information about RGB in Go
- Update the cluster centers to reflect their members average position
- This took a while to figure out. I did not want to use a map or list of points that are members of each cluster, so I looked for another way.
- I came up with this: let c.X and p.X be the x value of the center and point respectively. c.members is the number of points in this cluster already
c.X += (c.X - p.X) / c.Members. This worked regardless of if p.X was greater or less than c.X. - This is where I may run into some trouble in the future with precision because I again used integer math instead of floating point.
- I came up with this: let c.X and p.X be the x value of the center and point respectively. c.members is the number of points in this cluster already
- This took a while to figure out. I did not want to use a map or list of points that are members of each cluster, so I looked for another way.
- Iterate the above steps until convergence.
- Some algorithms use a limited number of iterations, and I could still do that, but I think that the number would change depending on the image complexity.
- I could try to do it until all but X% of points have converged, where X is defined by the user, but this is something to look at later.
- Some algorithms use a limited number of iterations, and I could still do that, but I think that the number would change depending on the image complexity.
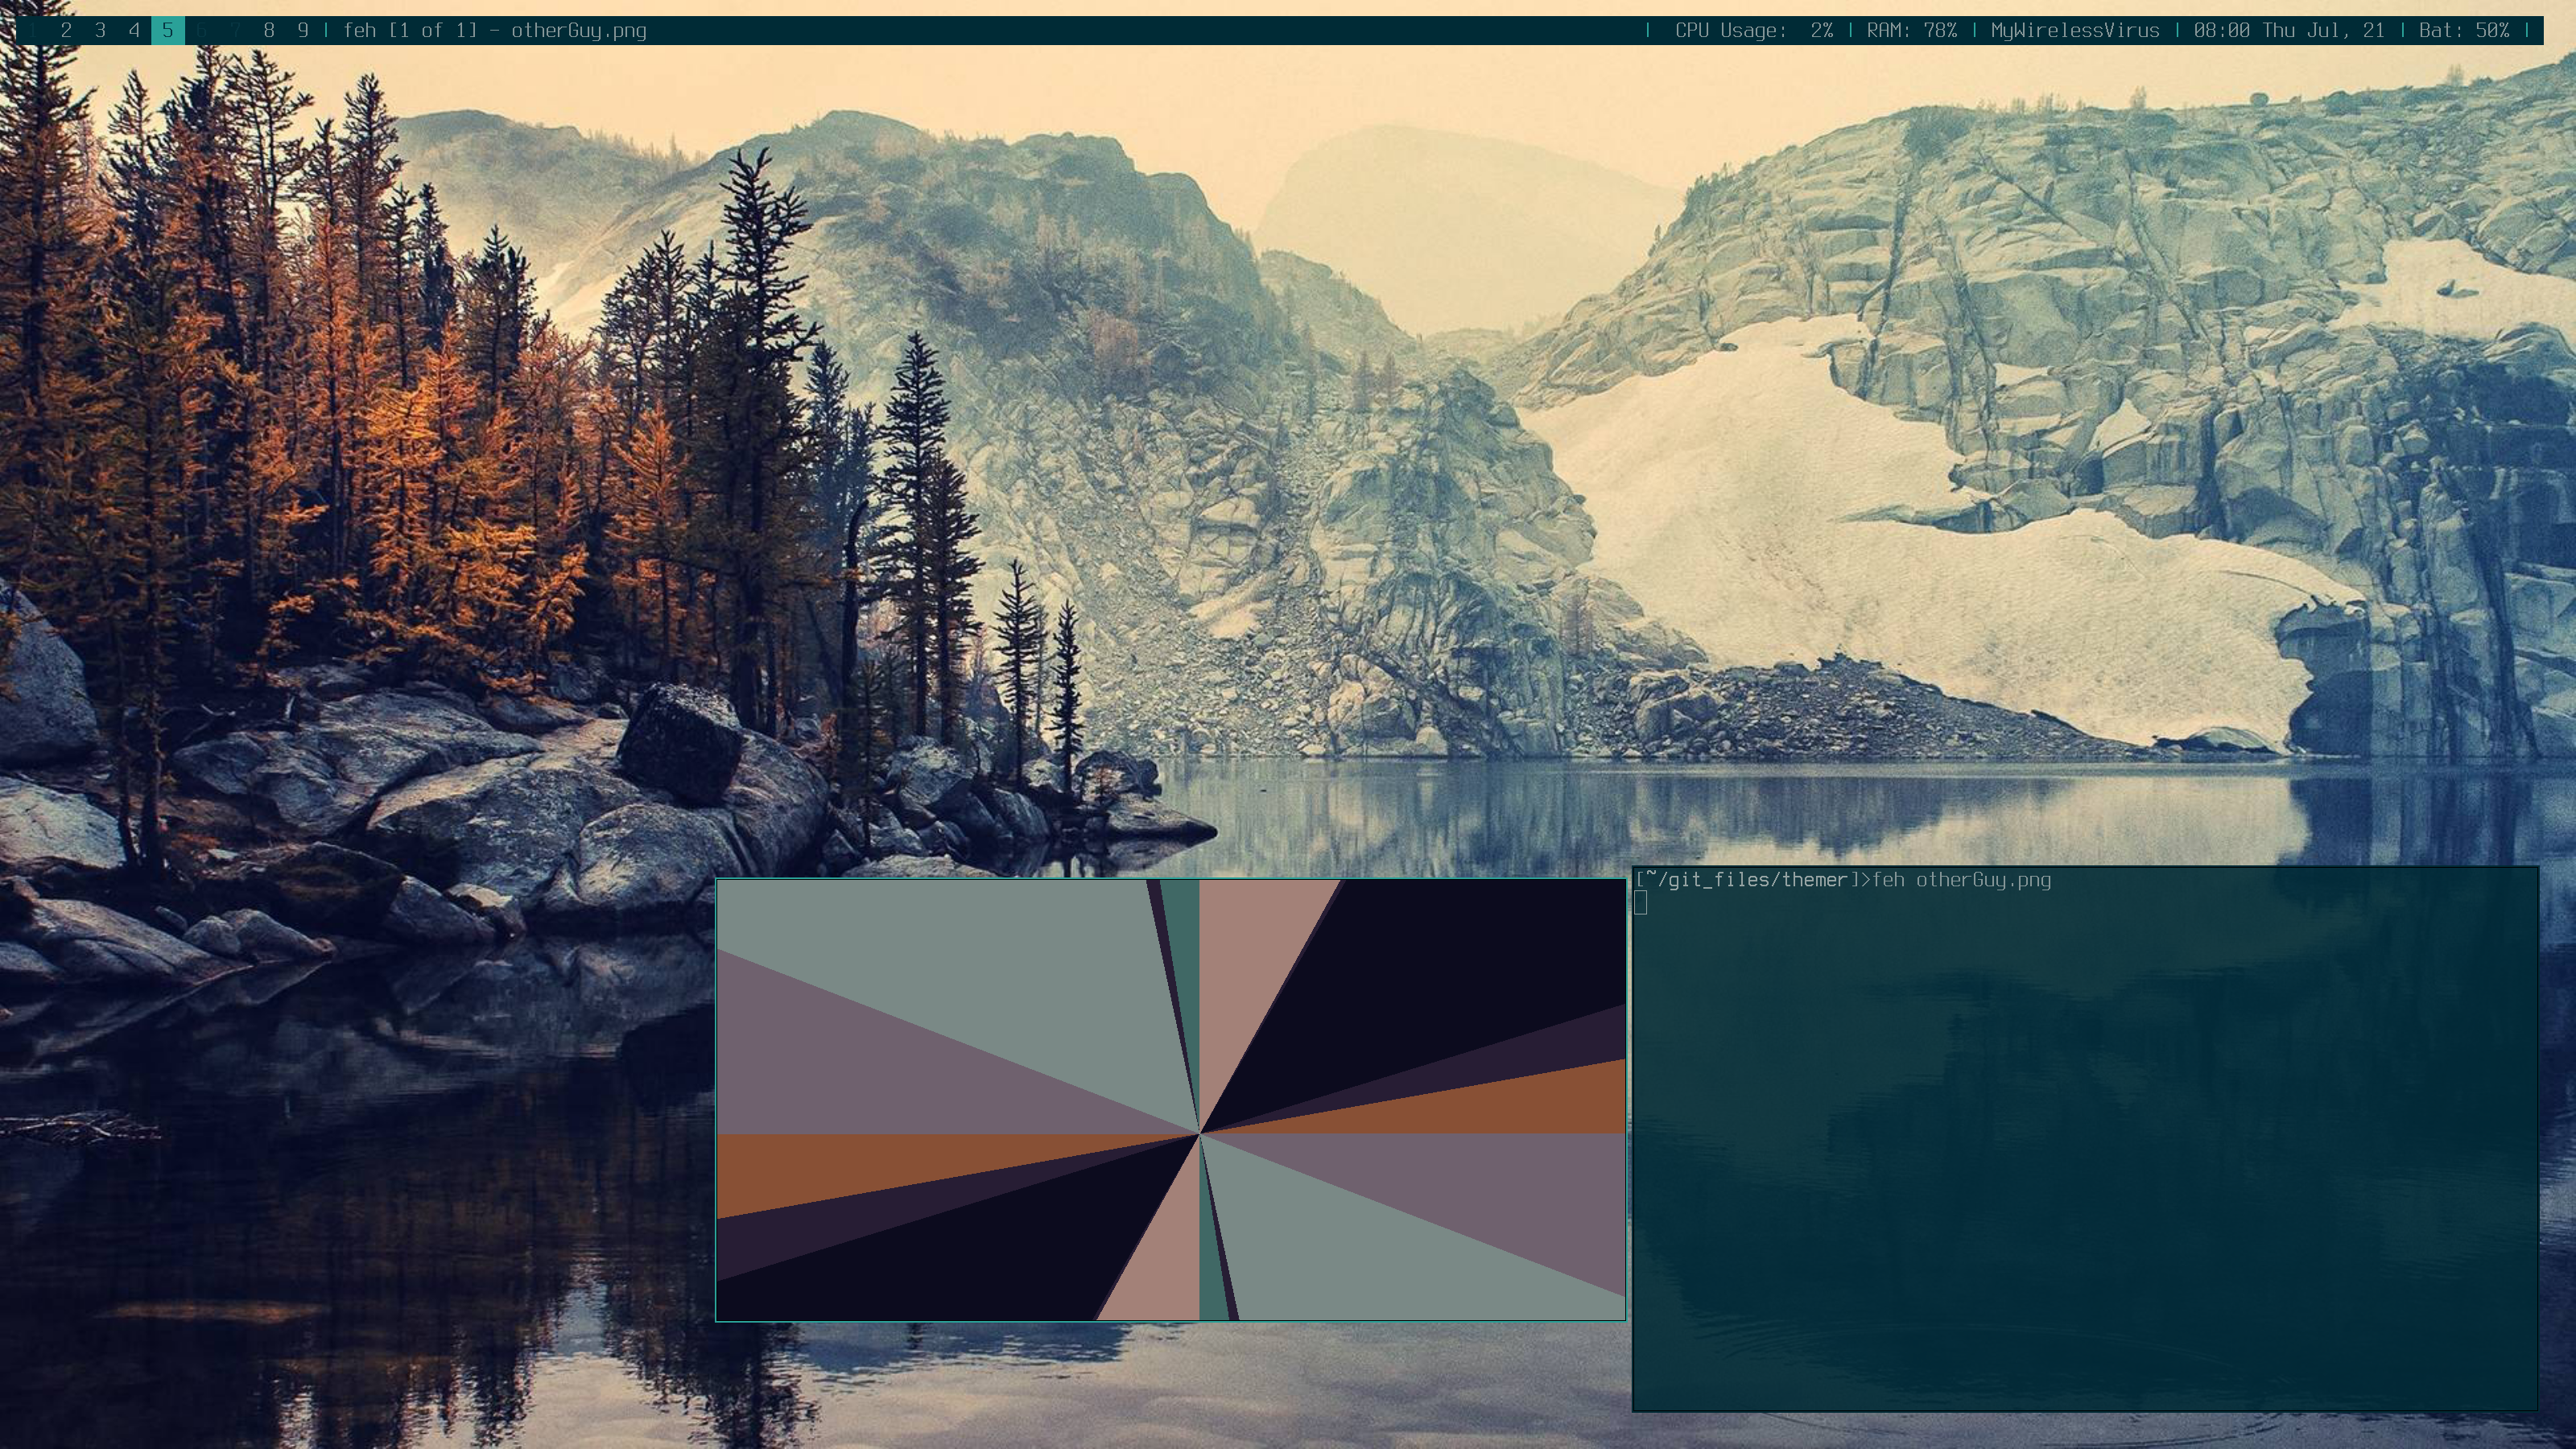
After all of that I was finally done, my program was perfect, and nothing could go wrong.
K-means finds the best averages that will cover all points in the space, and the colors came out looking very… average.
I really liked some of the colors, the blues and grey were perfect, but I was really missing that orange that I wanted.
Unfortunately, this output was correct. I didn’t make a mistake in my code that lead to these bland colors, it was just that if you average colors together, you tend to get bland colors.
The program chose the 10 colors that would cover all of the pixels with the minimum squared distance total.
The problem is that because there are so few pixels that are the bright orange color I wanted, they just got lumped in with some other colors (the brown one on the right if you are curious) and were diluted down to nothing.
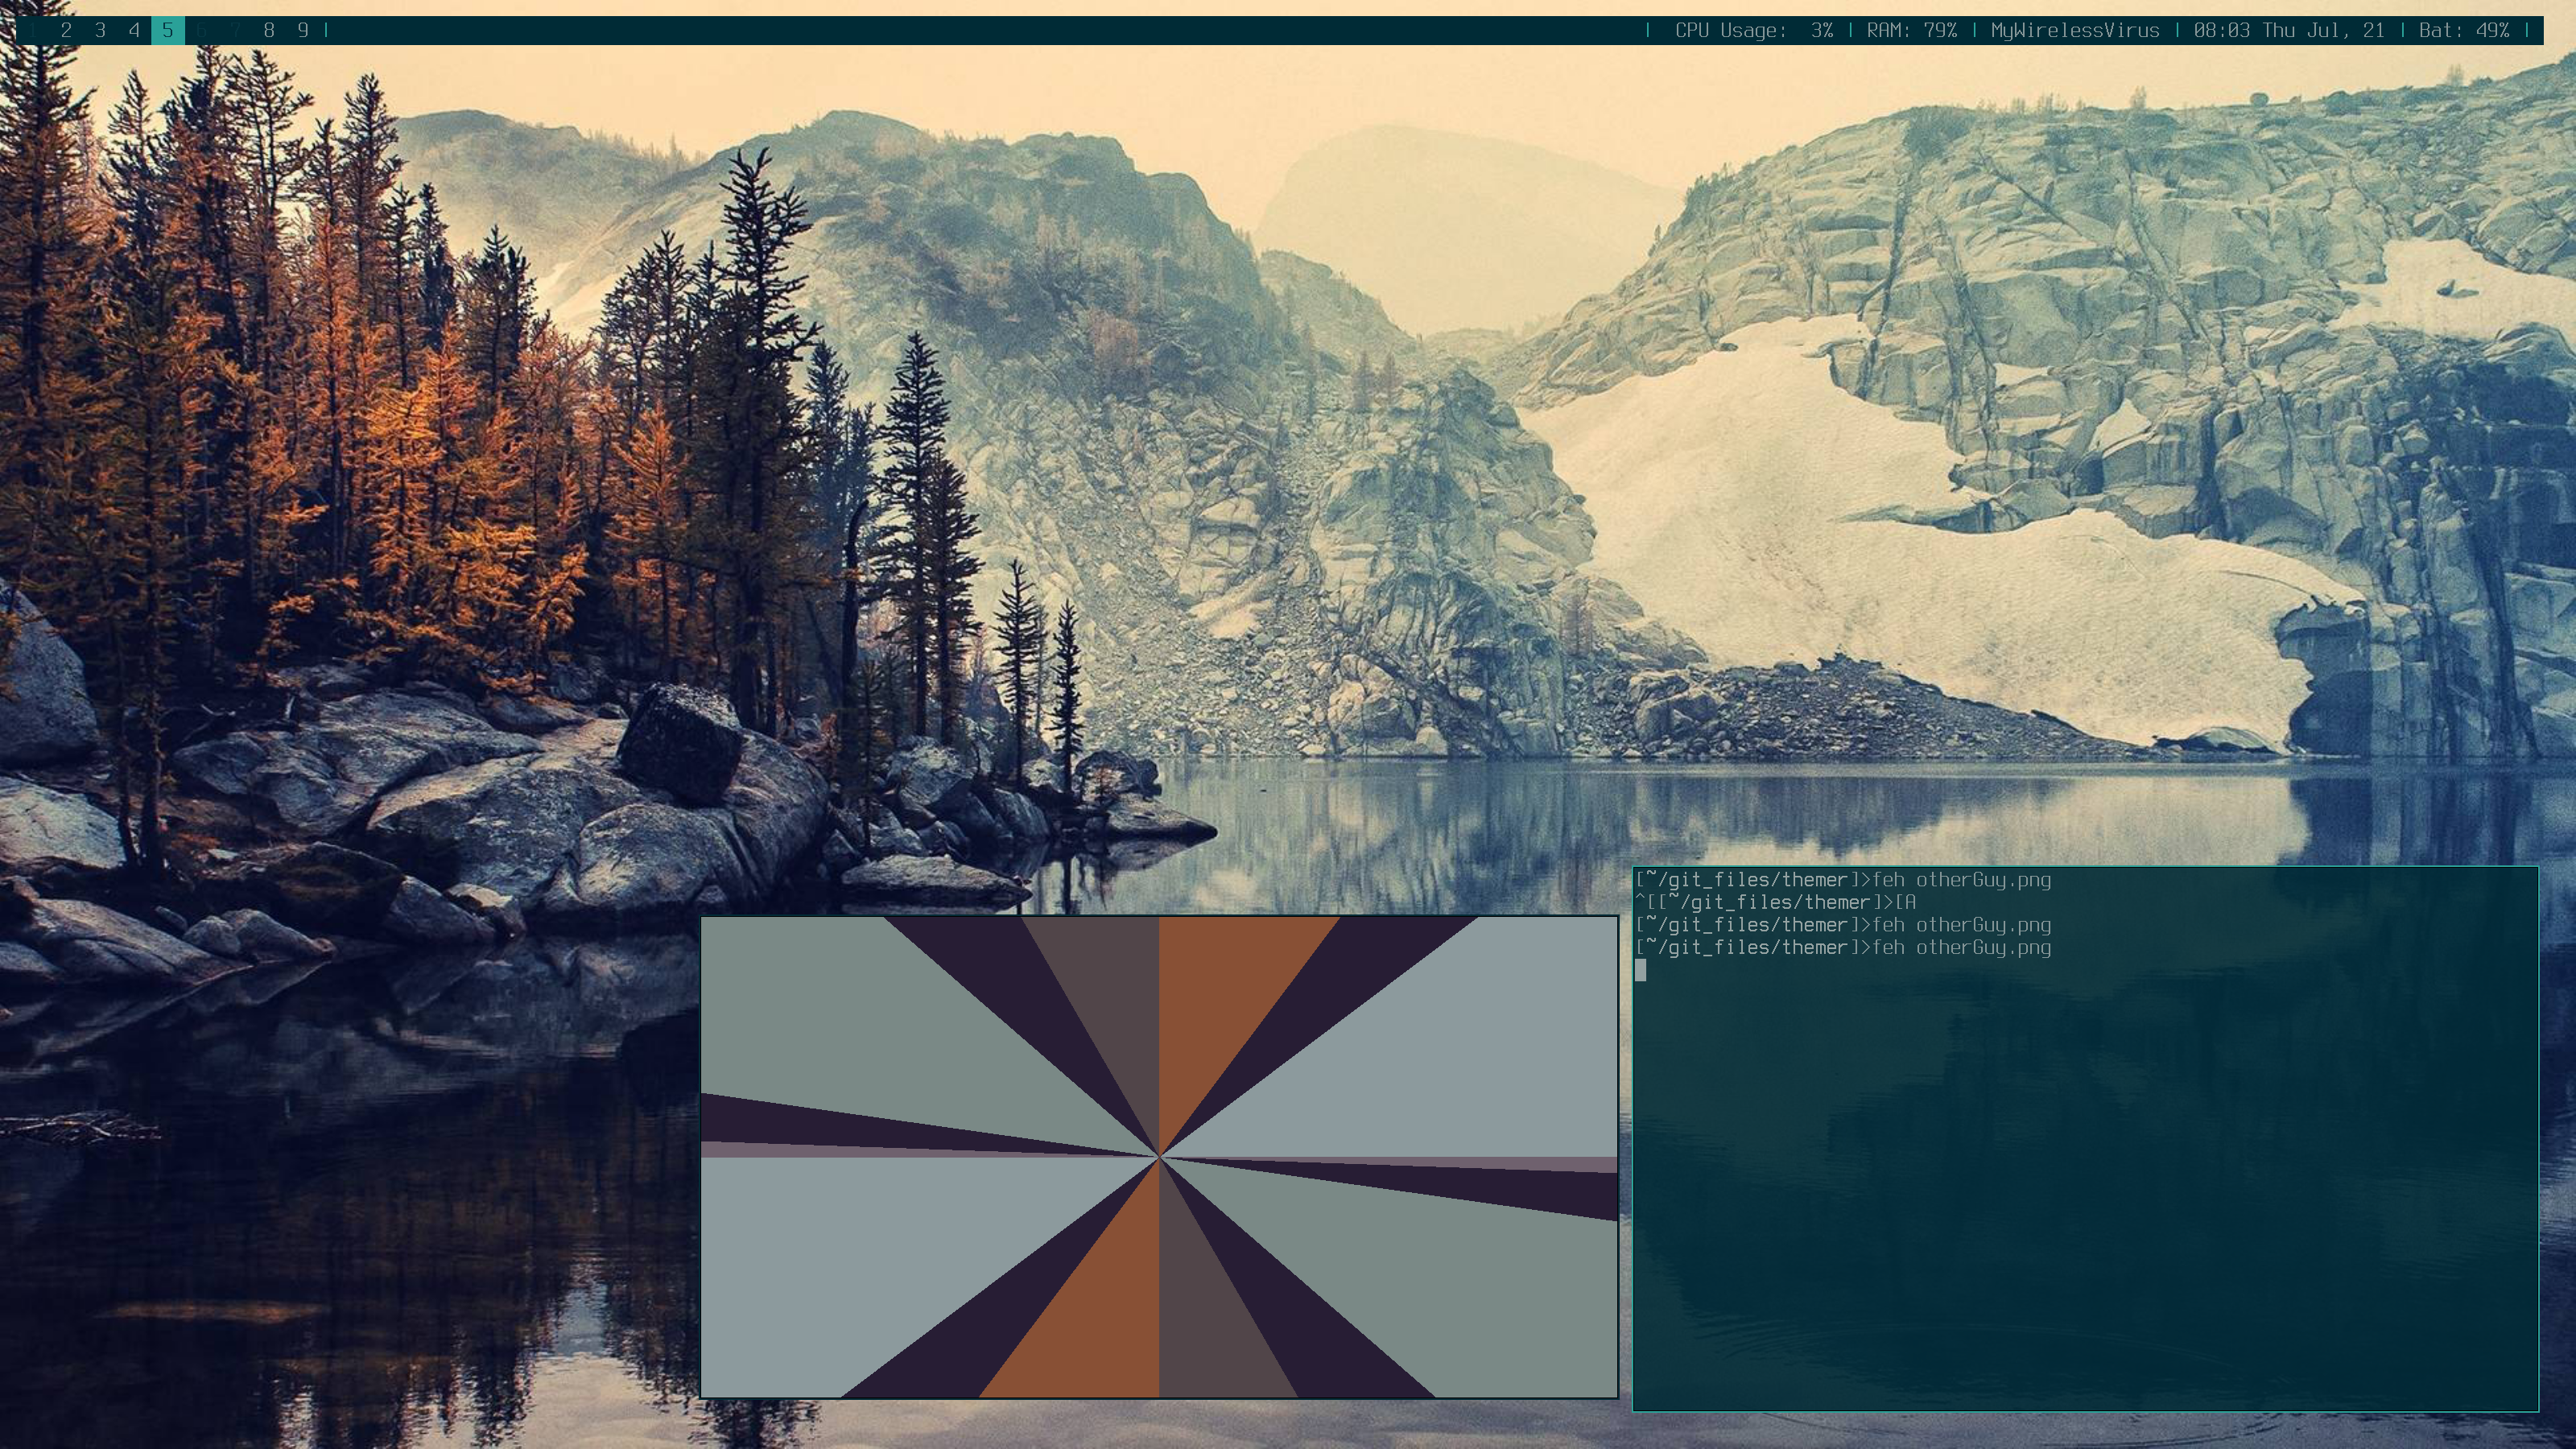
I use 8 colors in my terminal, and that was too few colors to allow the orange to be represented like I wanted, so I just ran it again with a lot more clusters.
I was getting nowhere fast, as even 50 clusters didn’t give me the color I wanted. Something else had to be done because just increasing the number wasn’t working.
Brightening colors
By definition of k-means the R, G, and B values tended to be similar. Bright colors on the other hand have much greater spread, with a lot of red and little green, or no blue and high red and green values, etc. This statement may seem obvious to some people, but I have rarely done anything with colors, so only after a long time did I realize this. Luckily it gave me a pretty good idea.
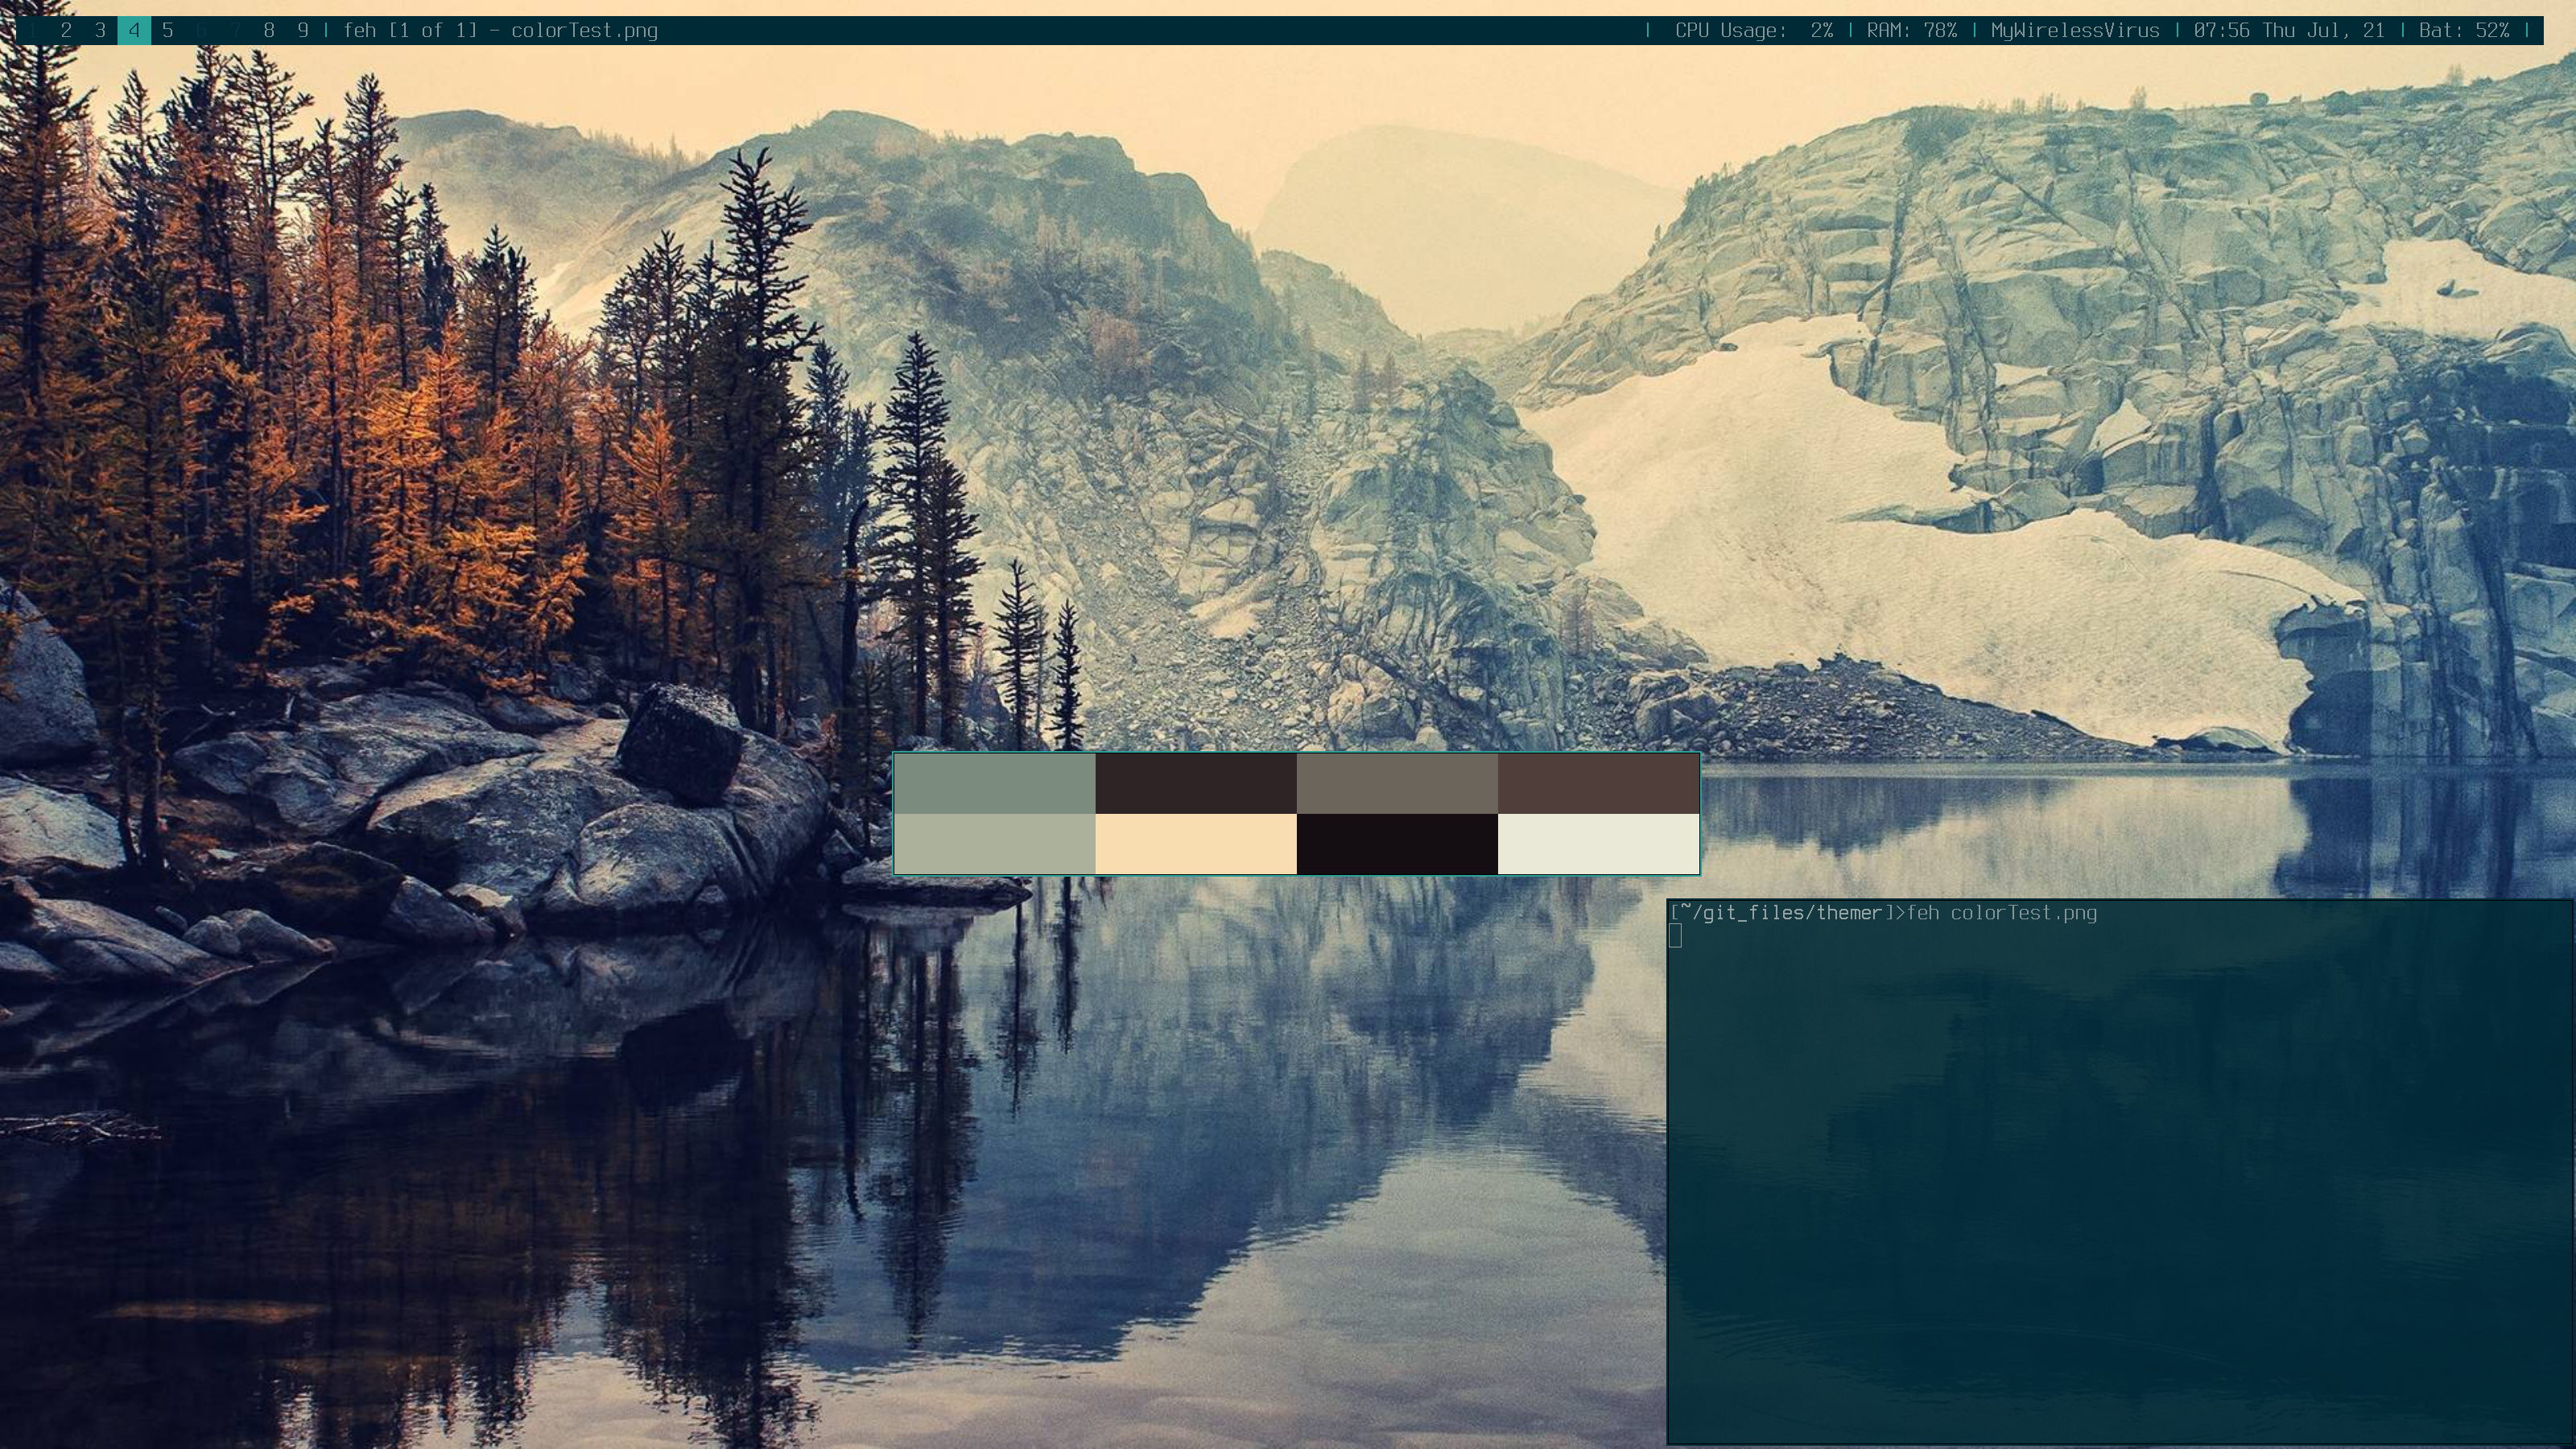
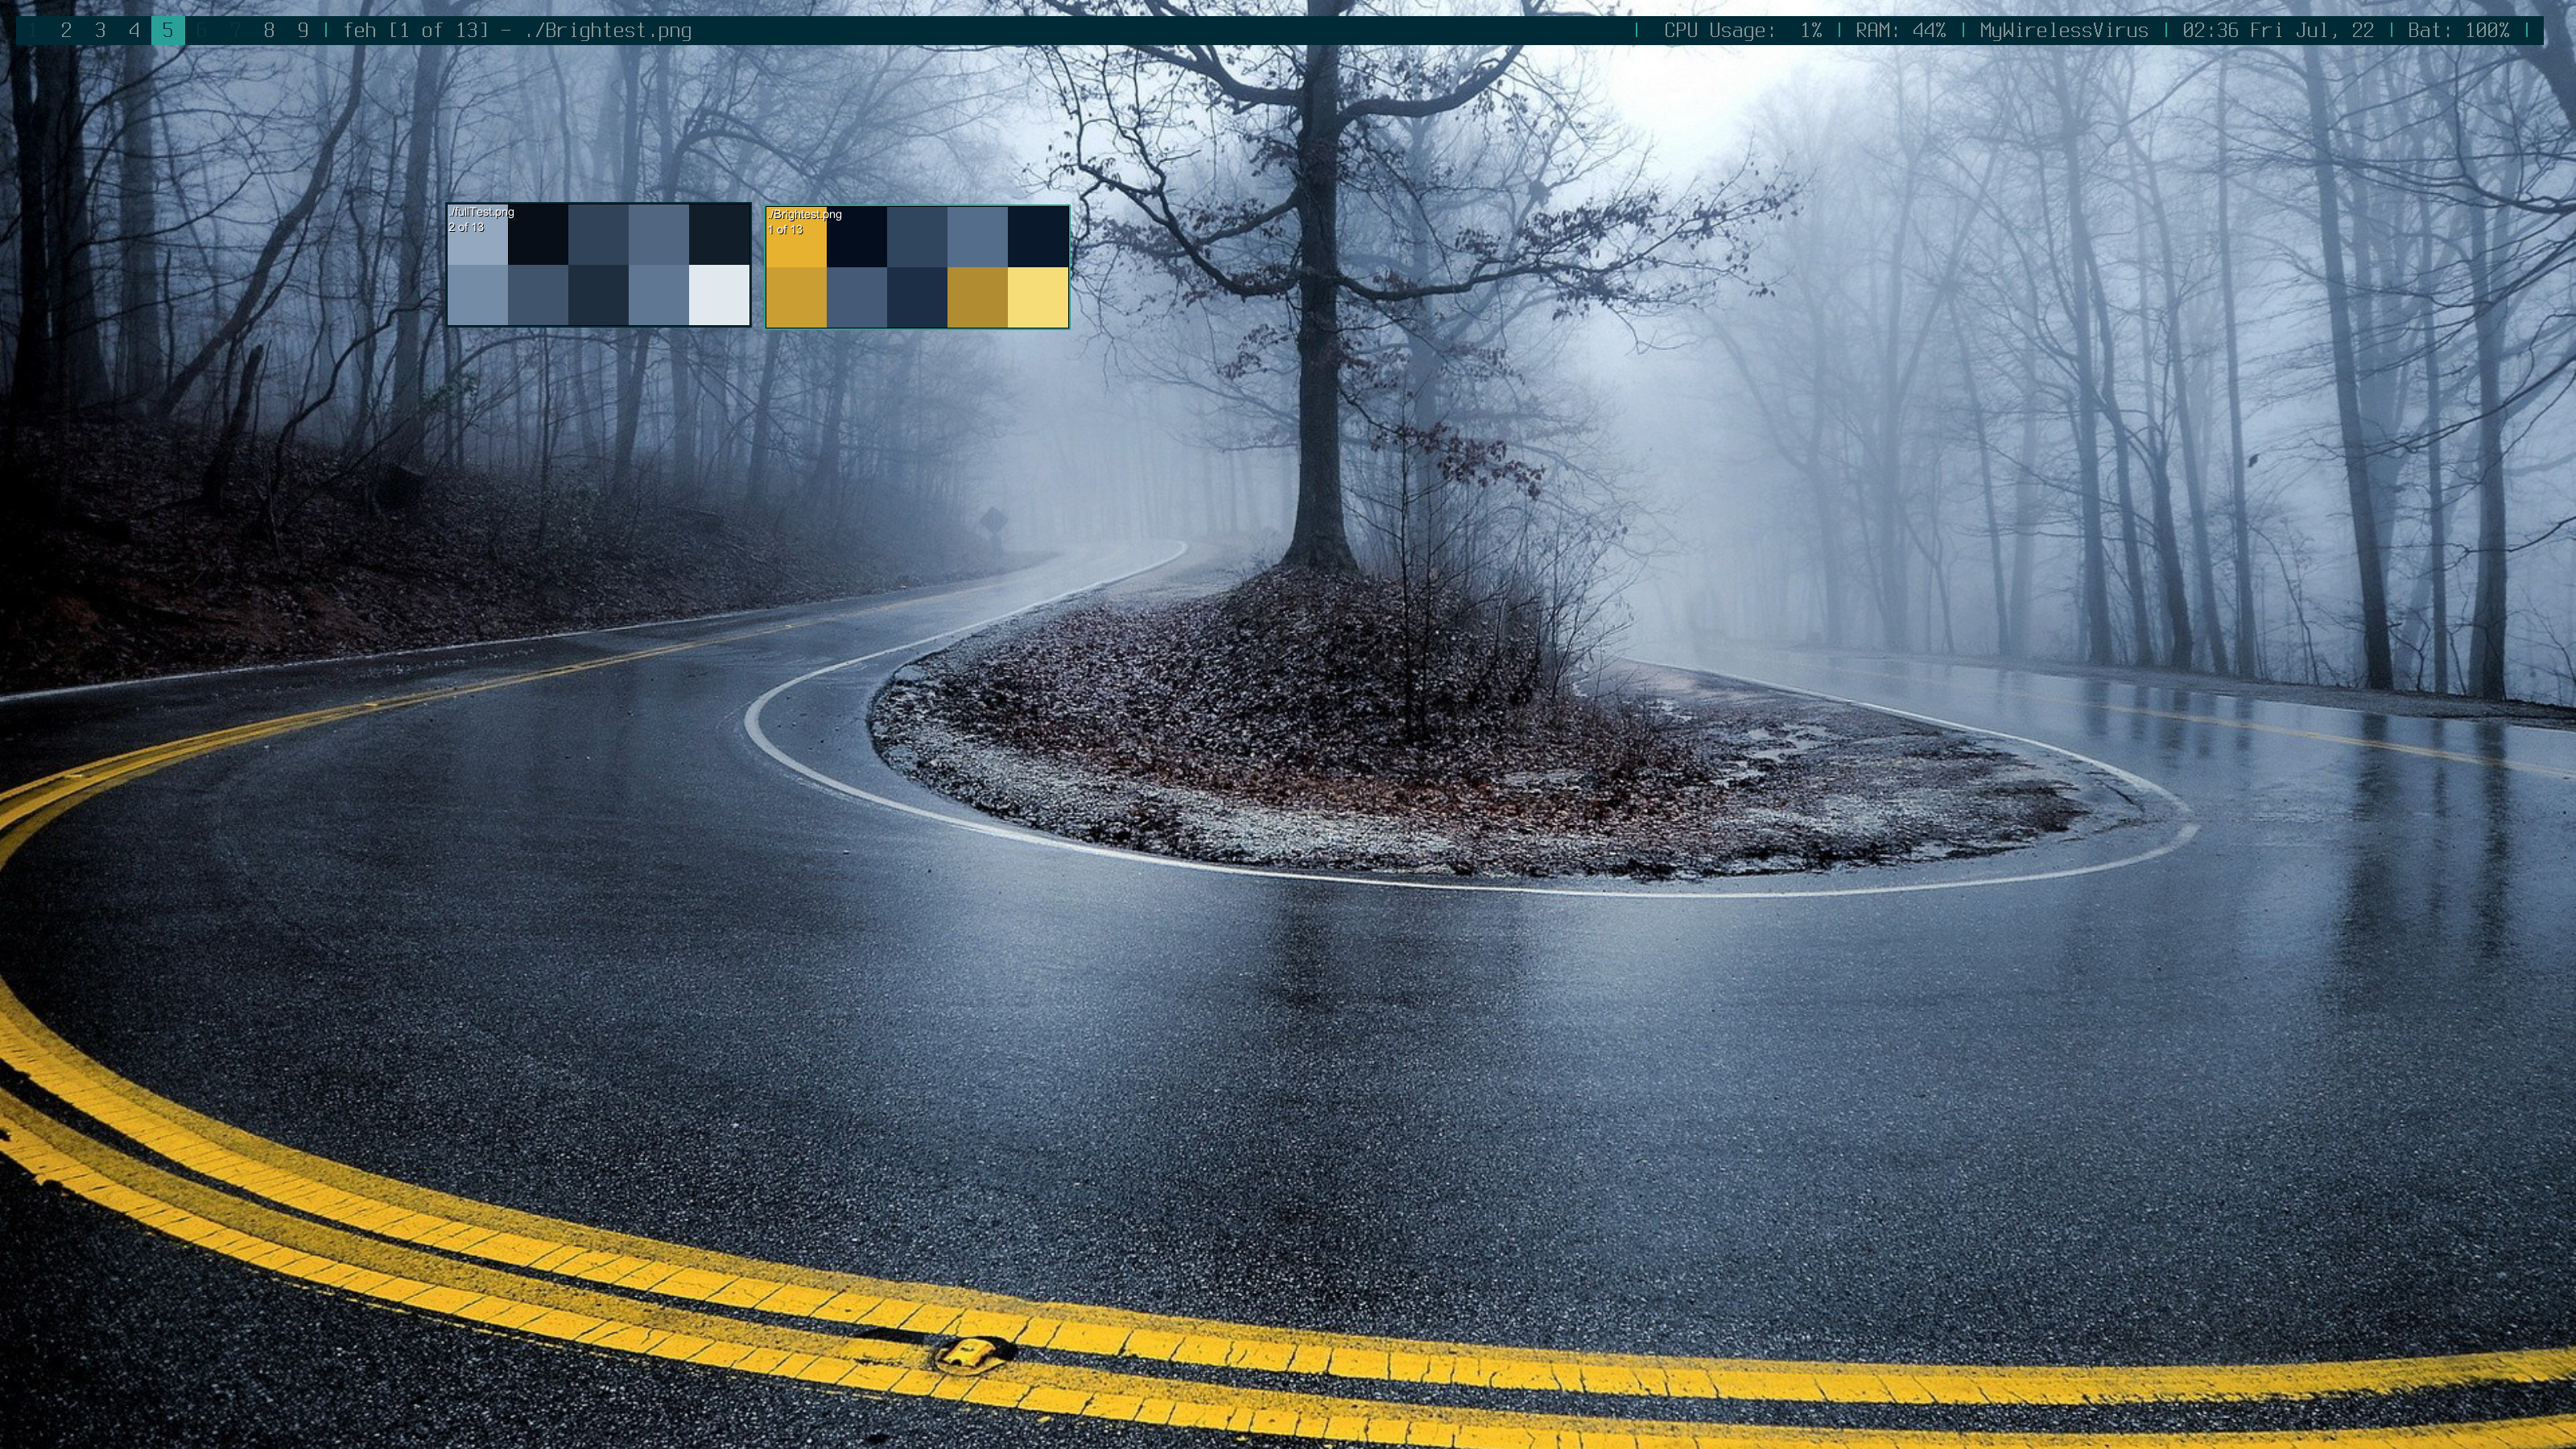
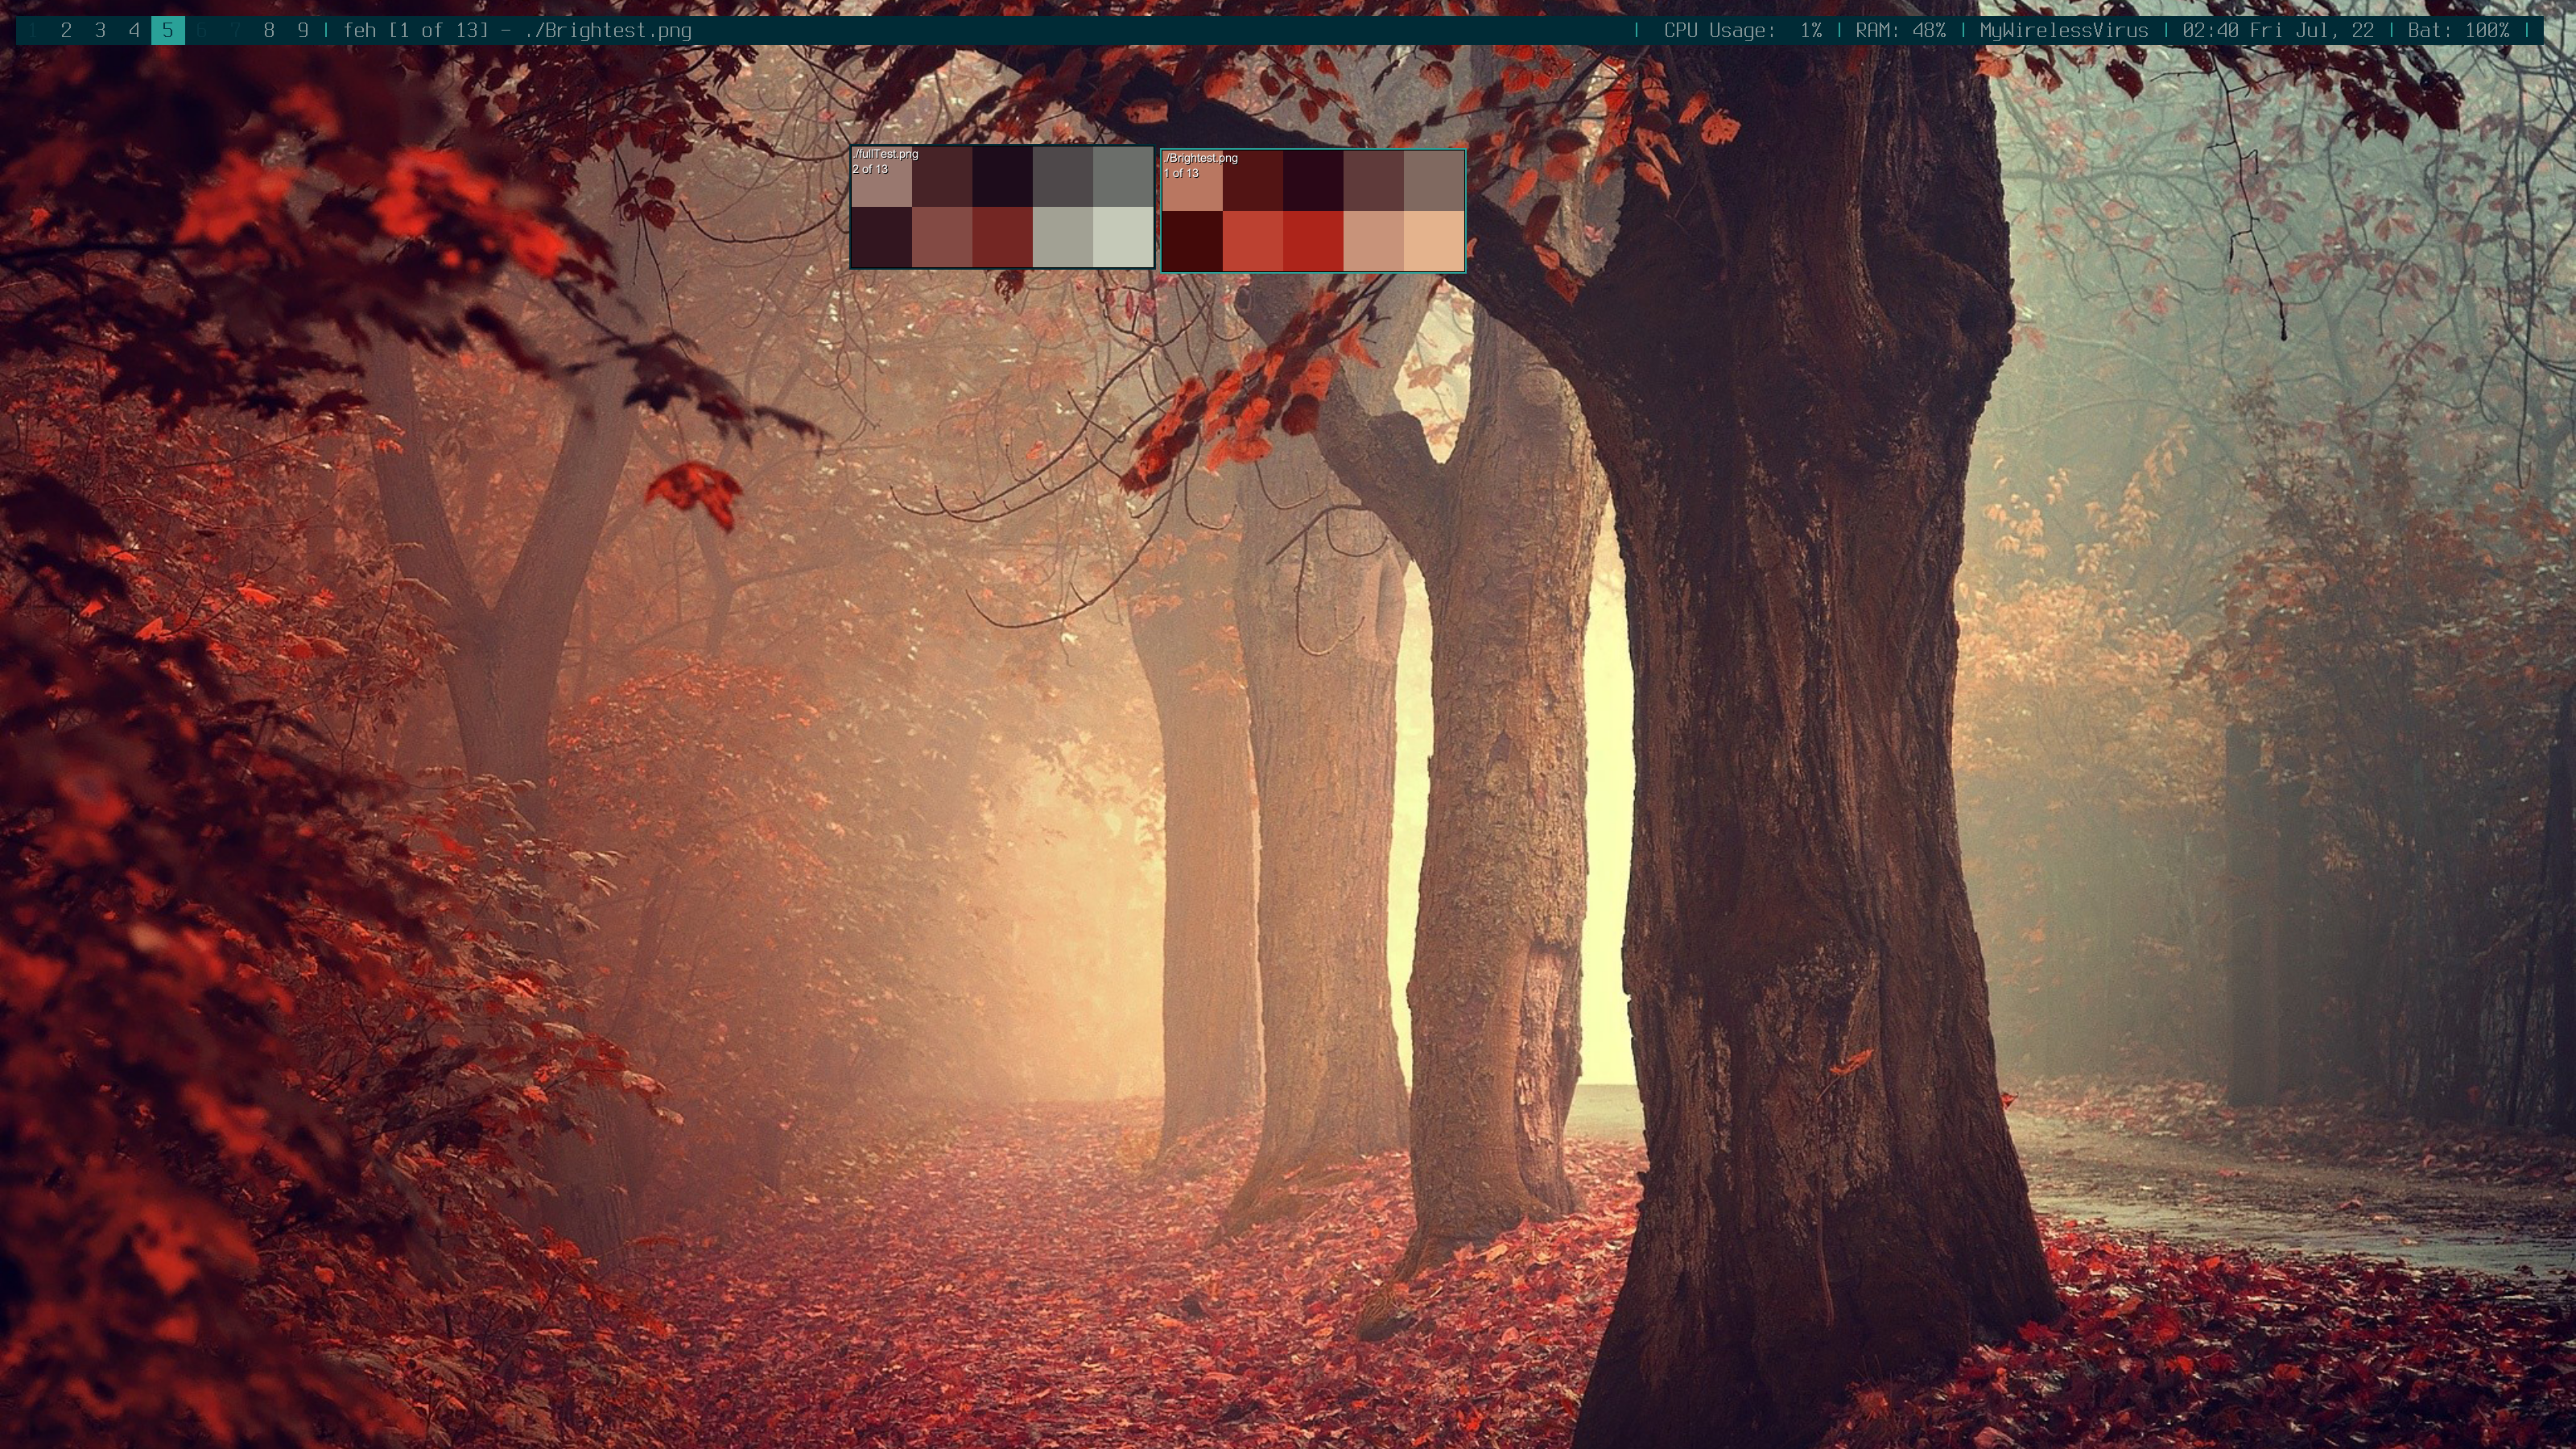
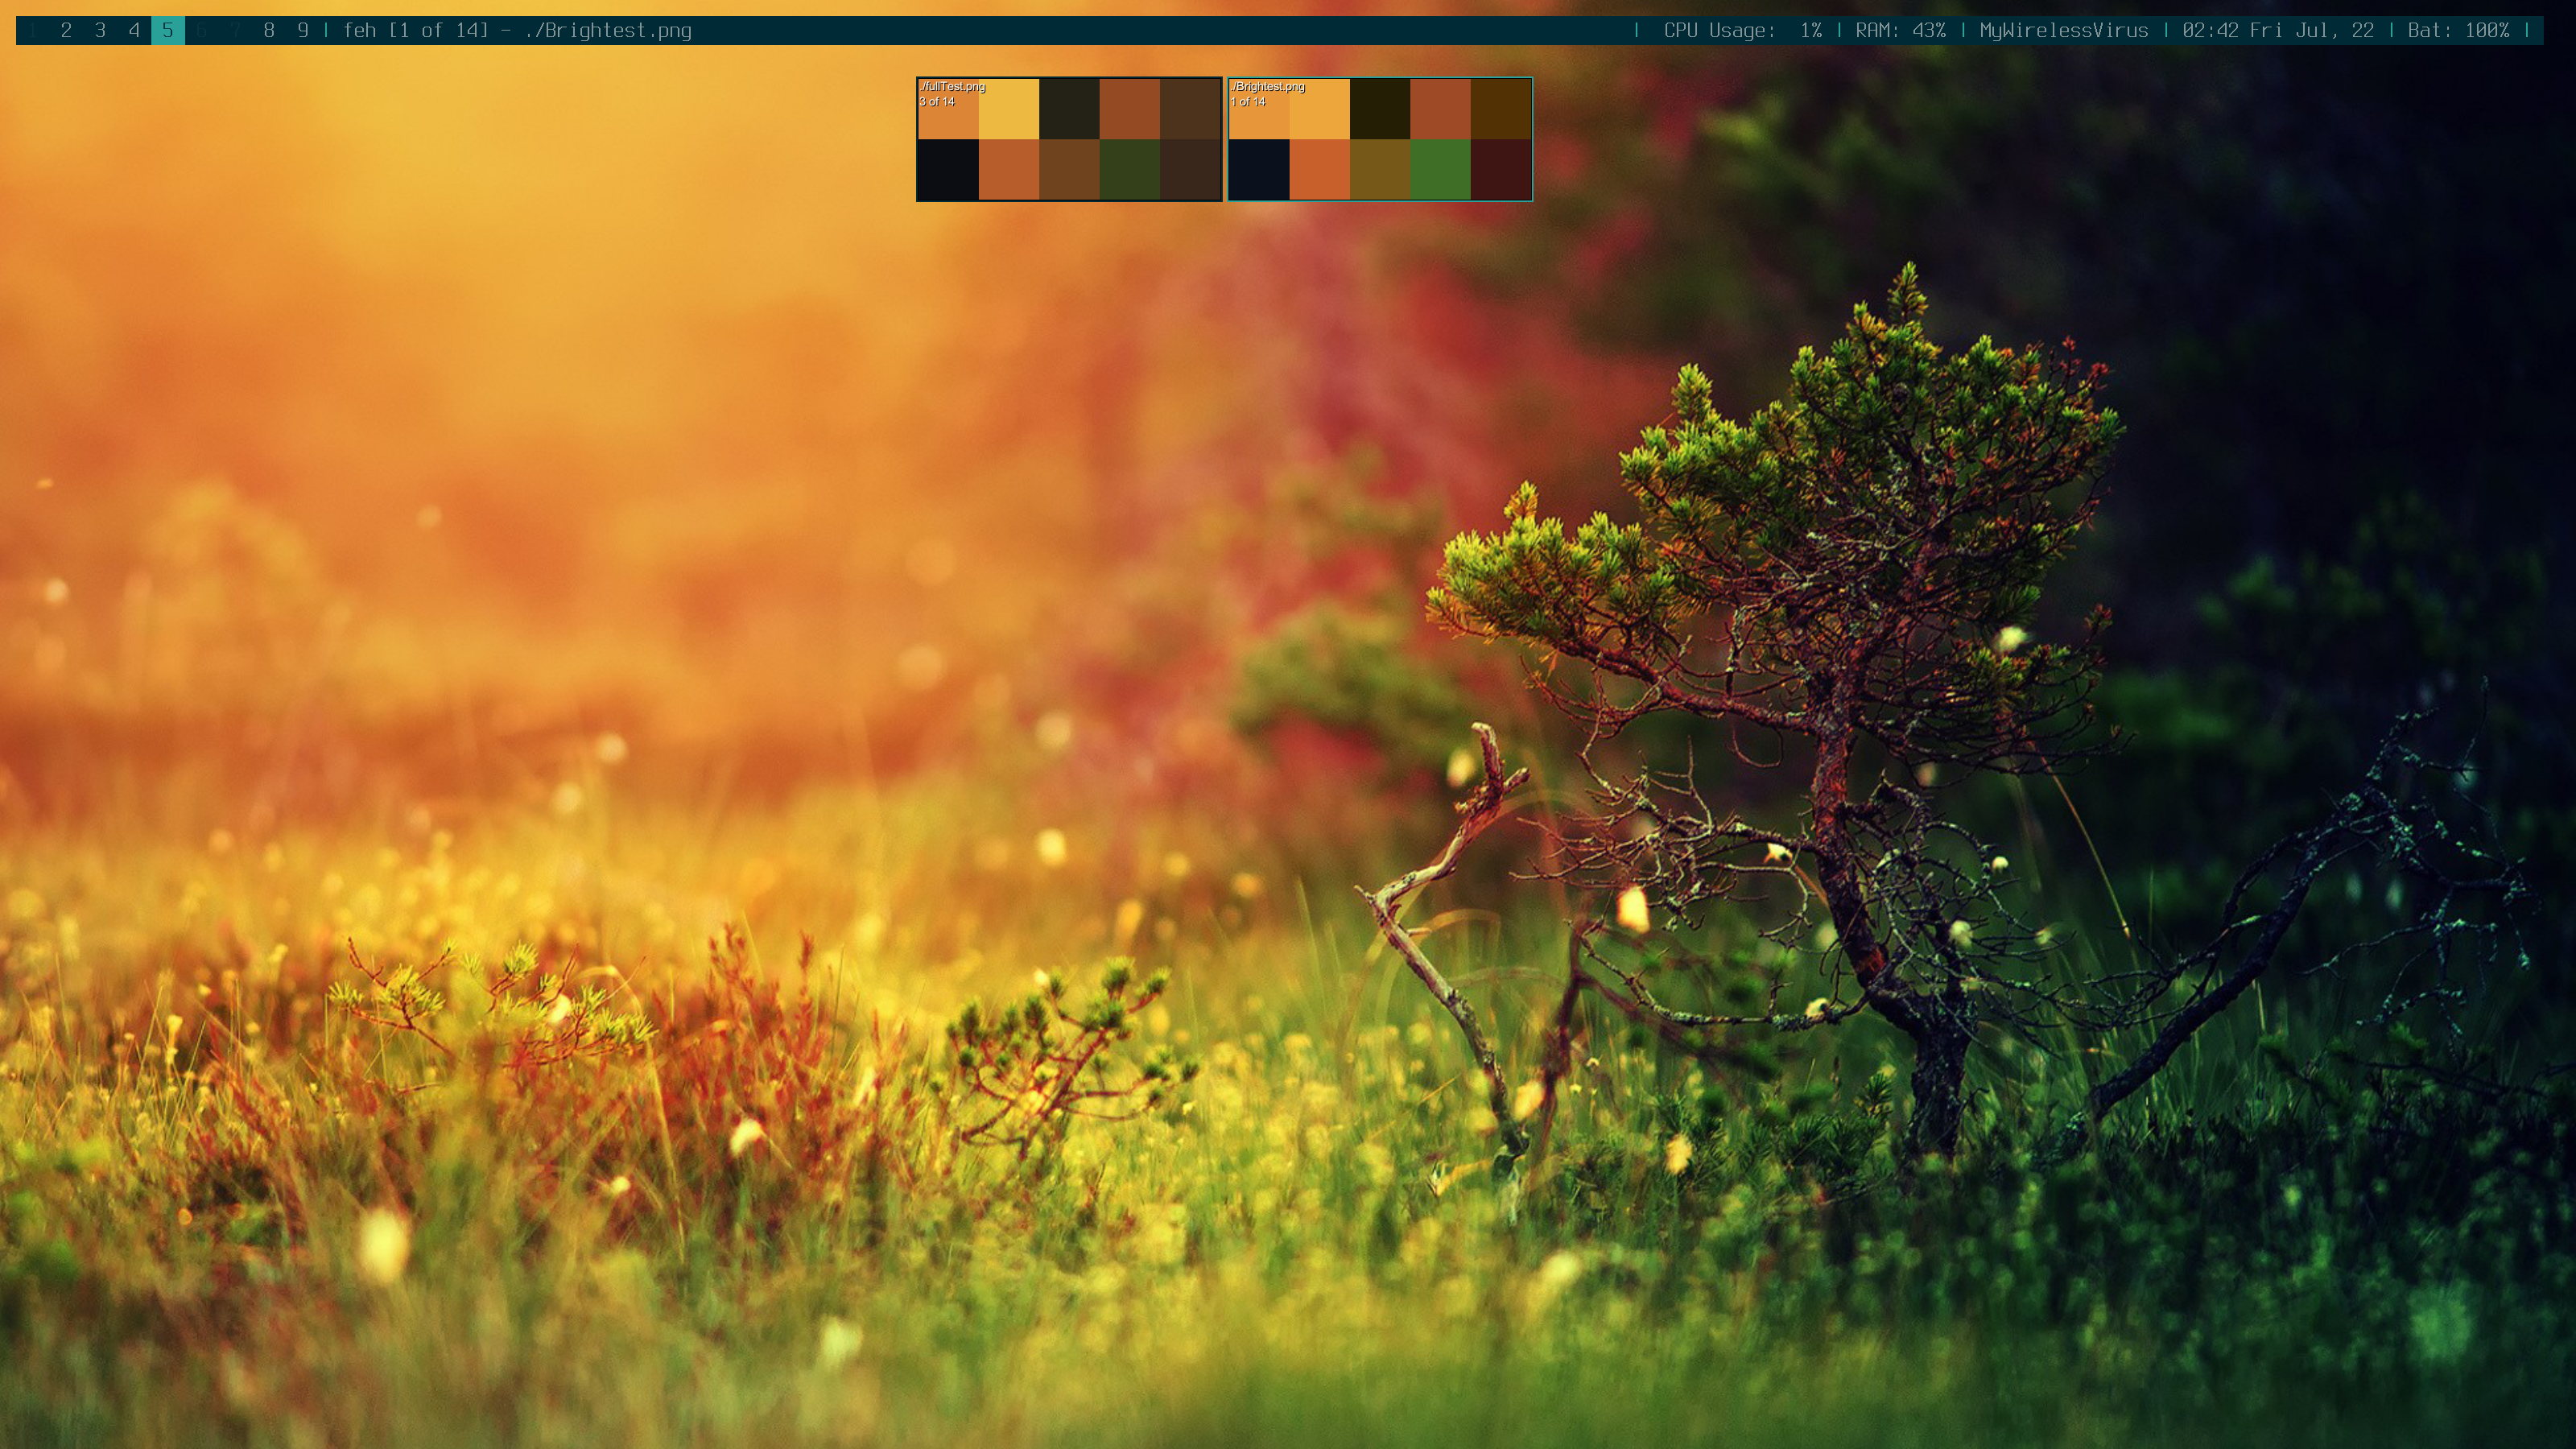
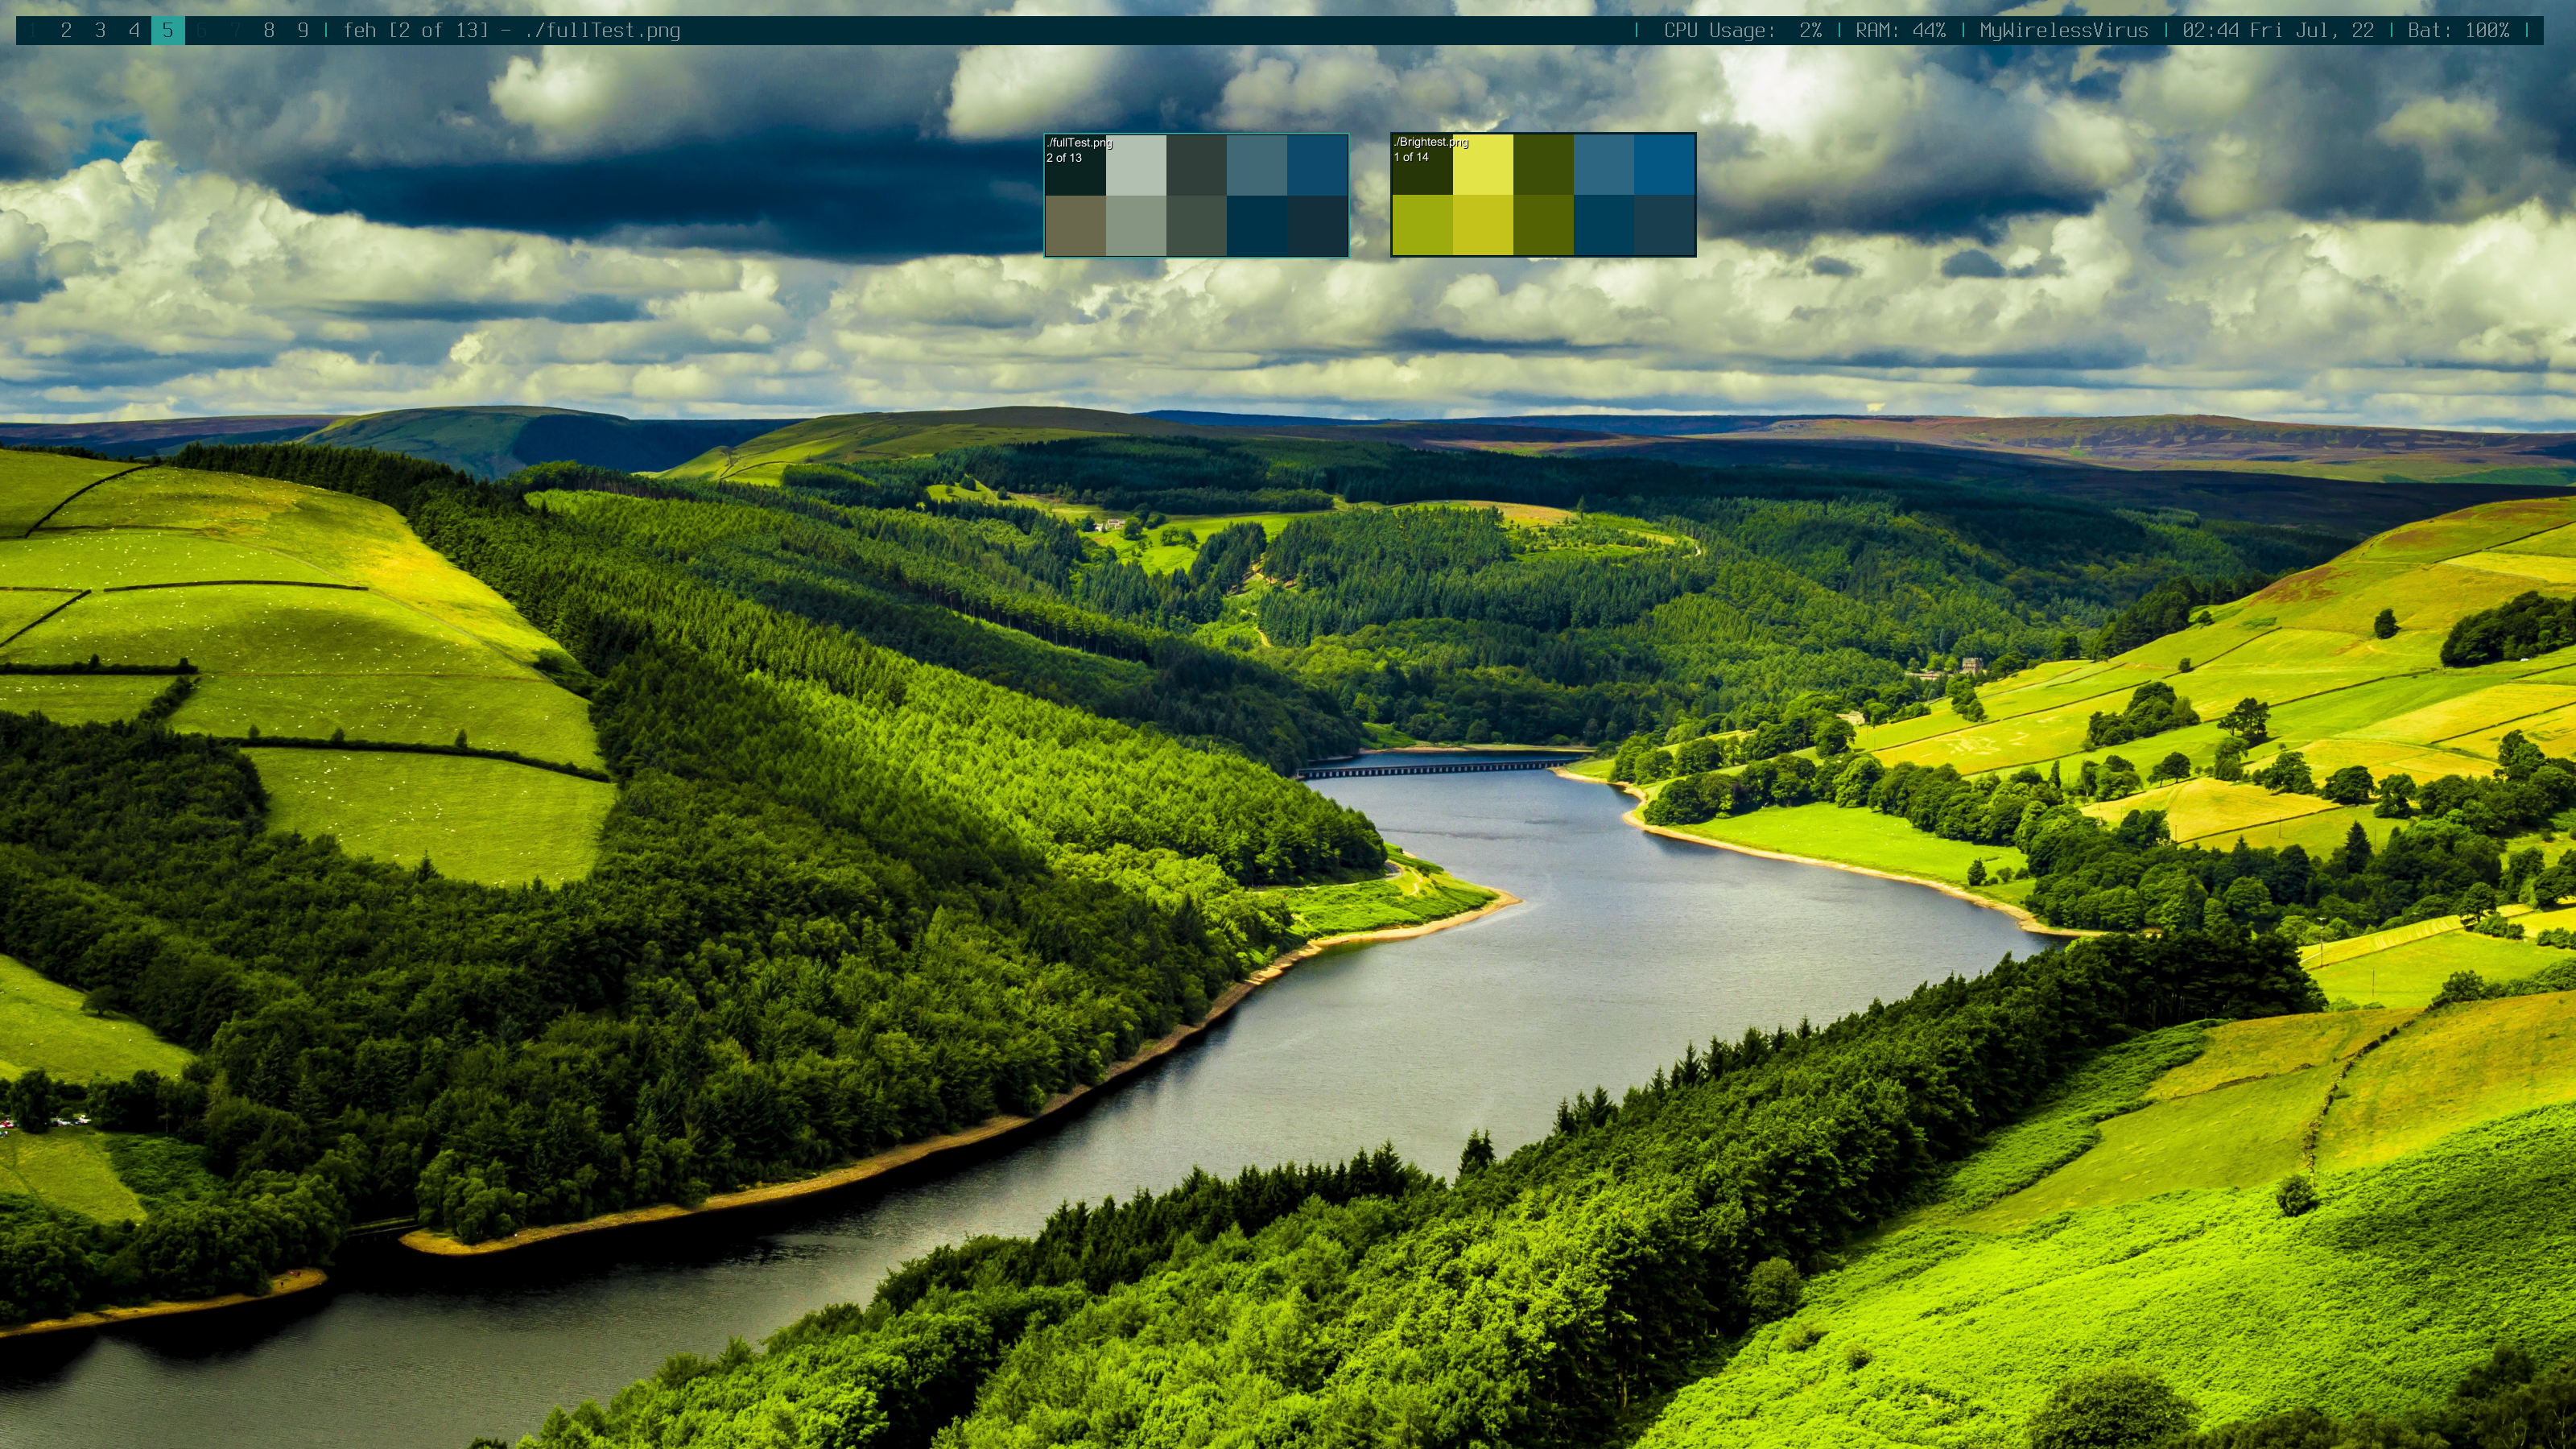
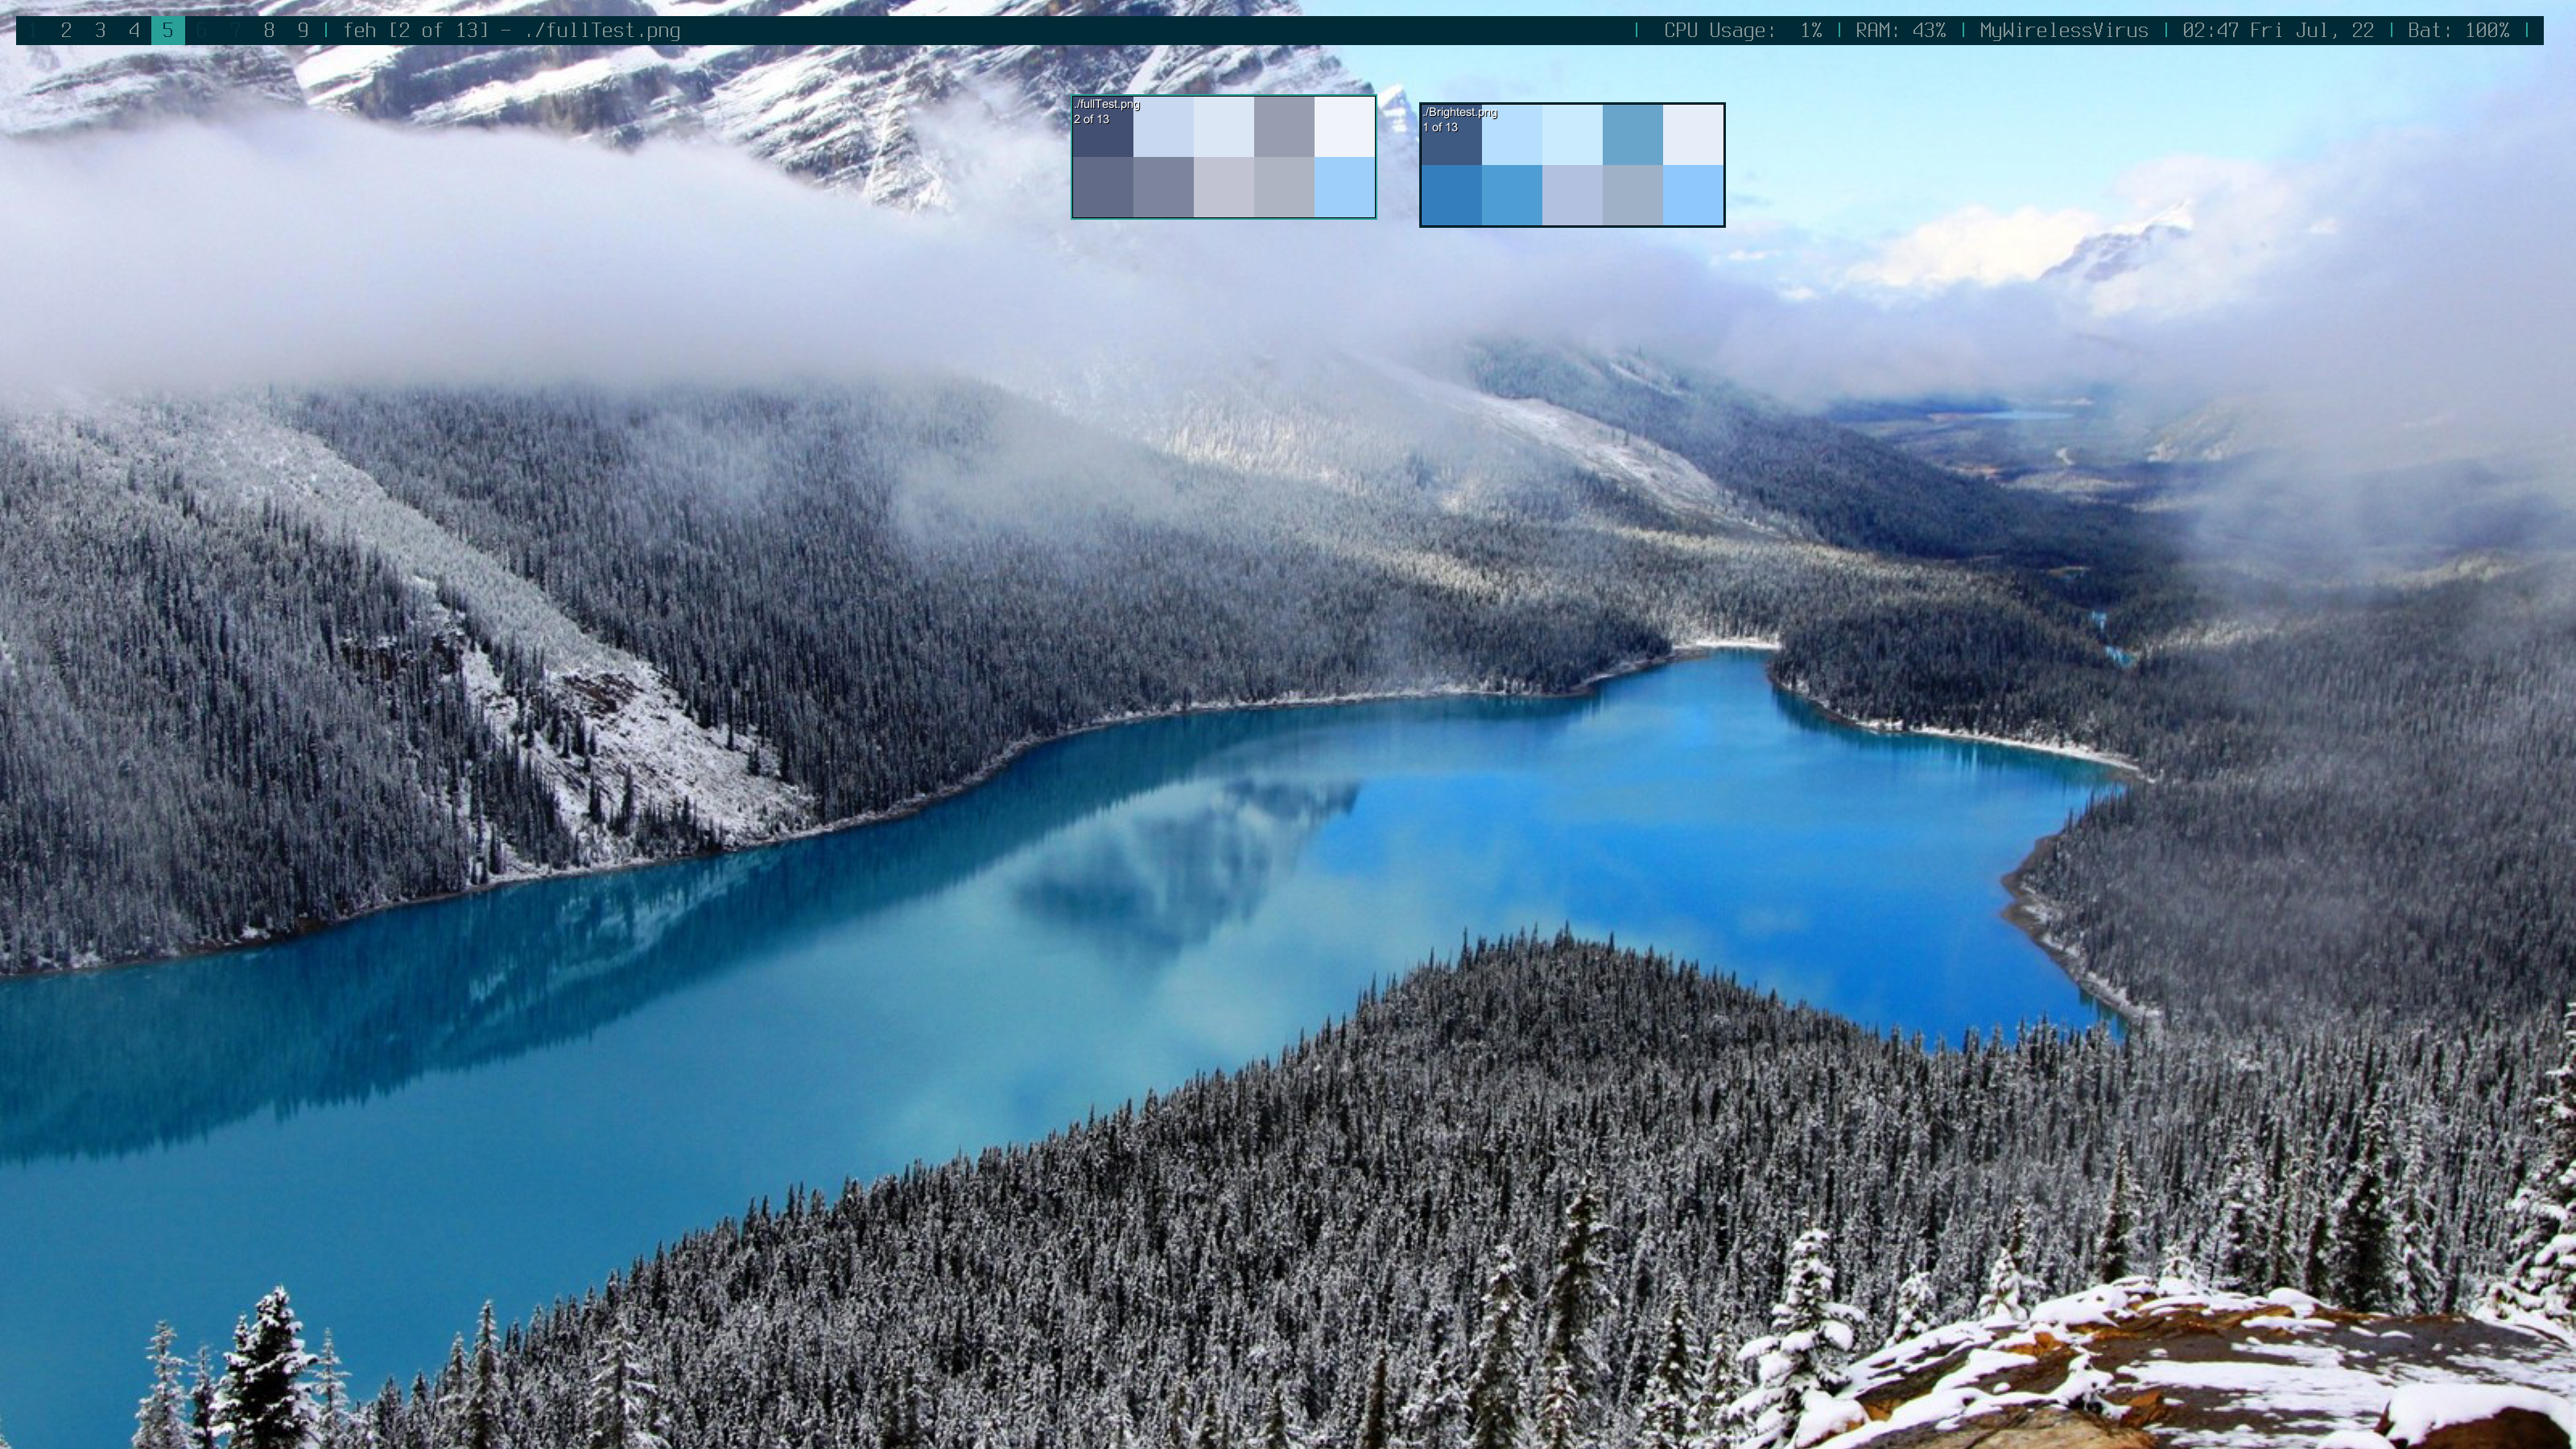
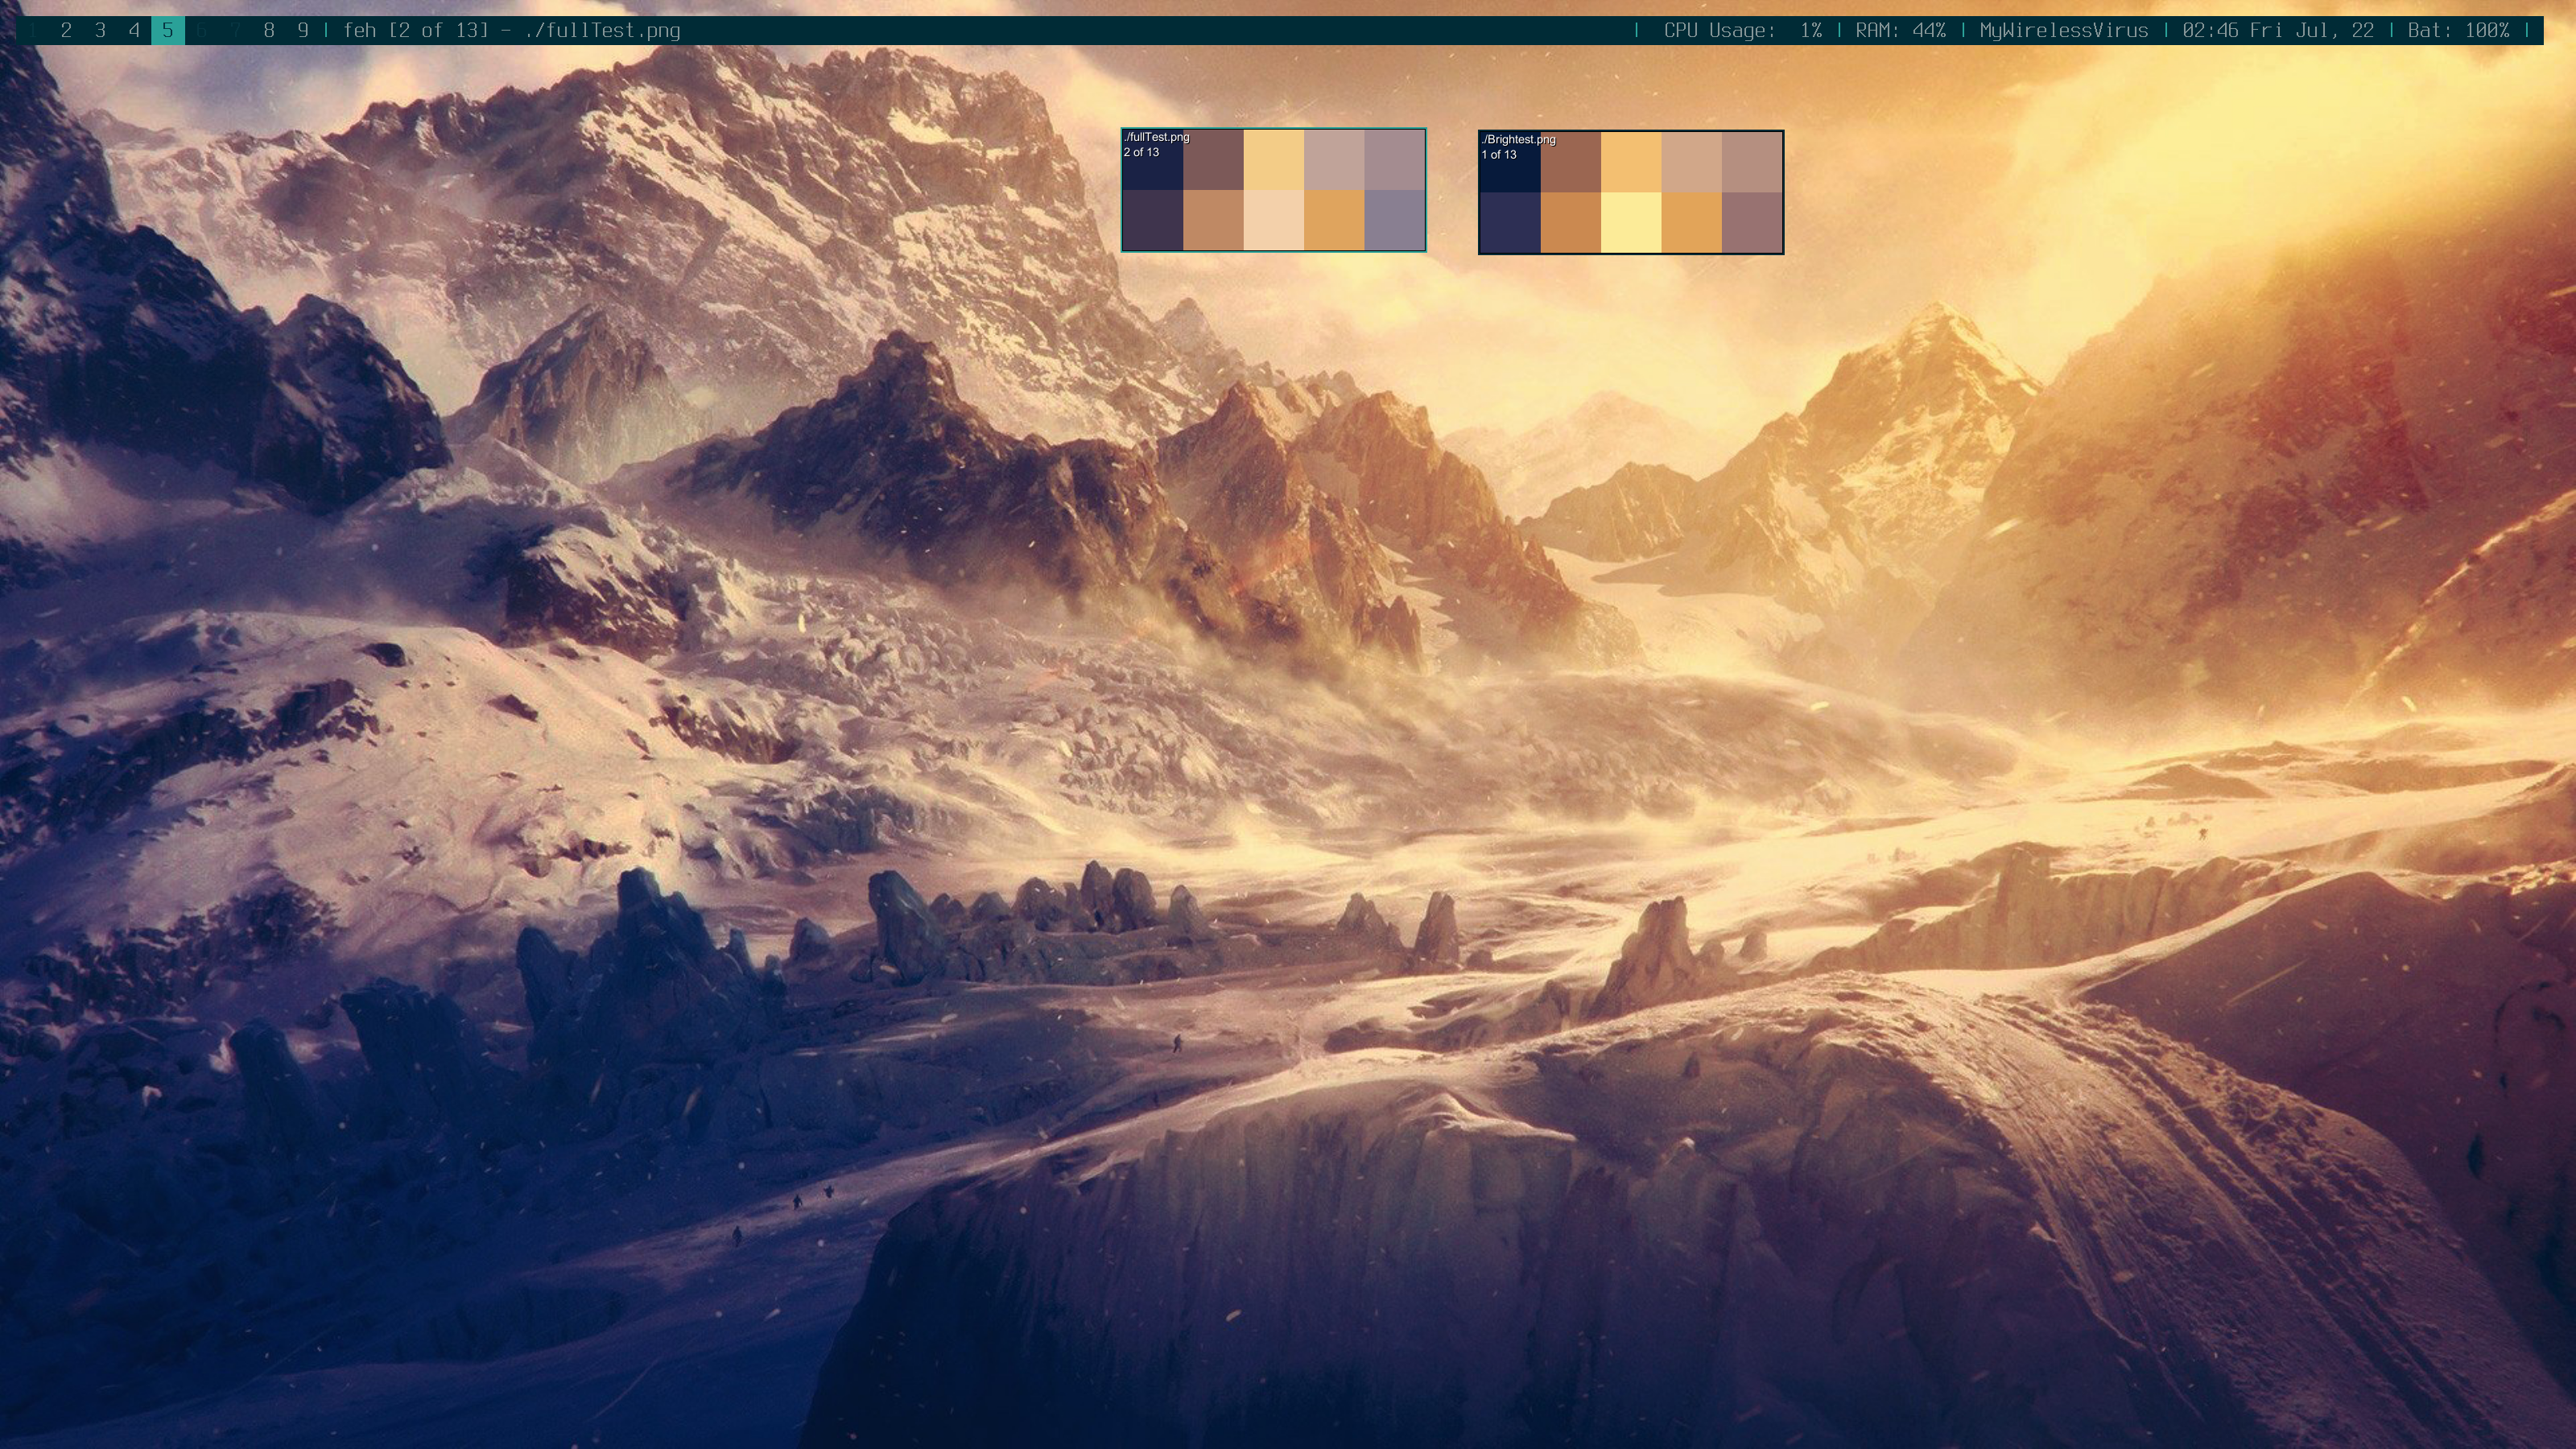
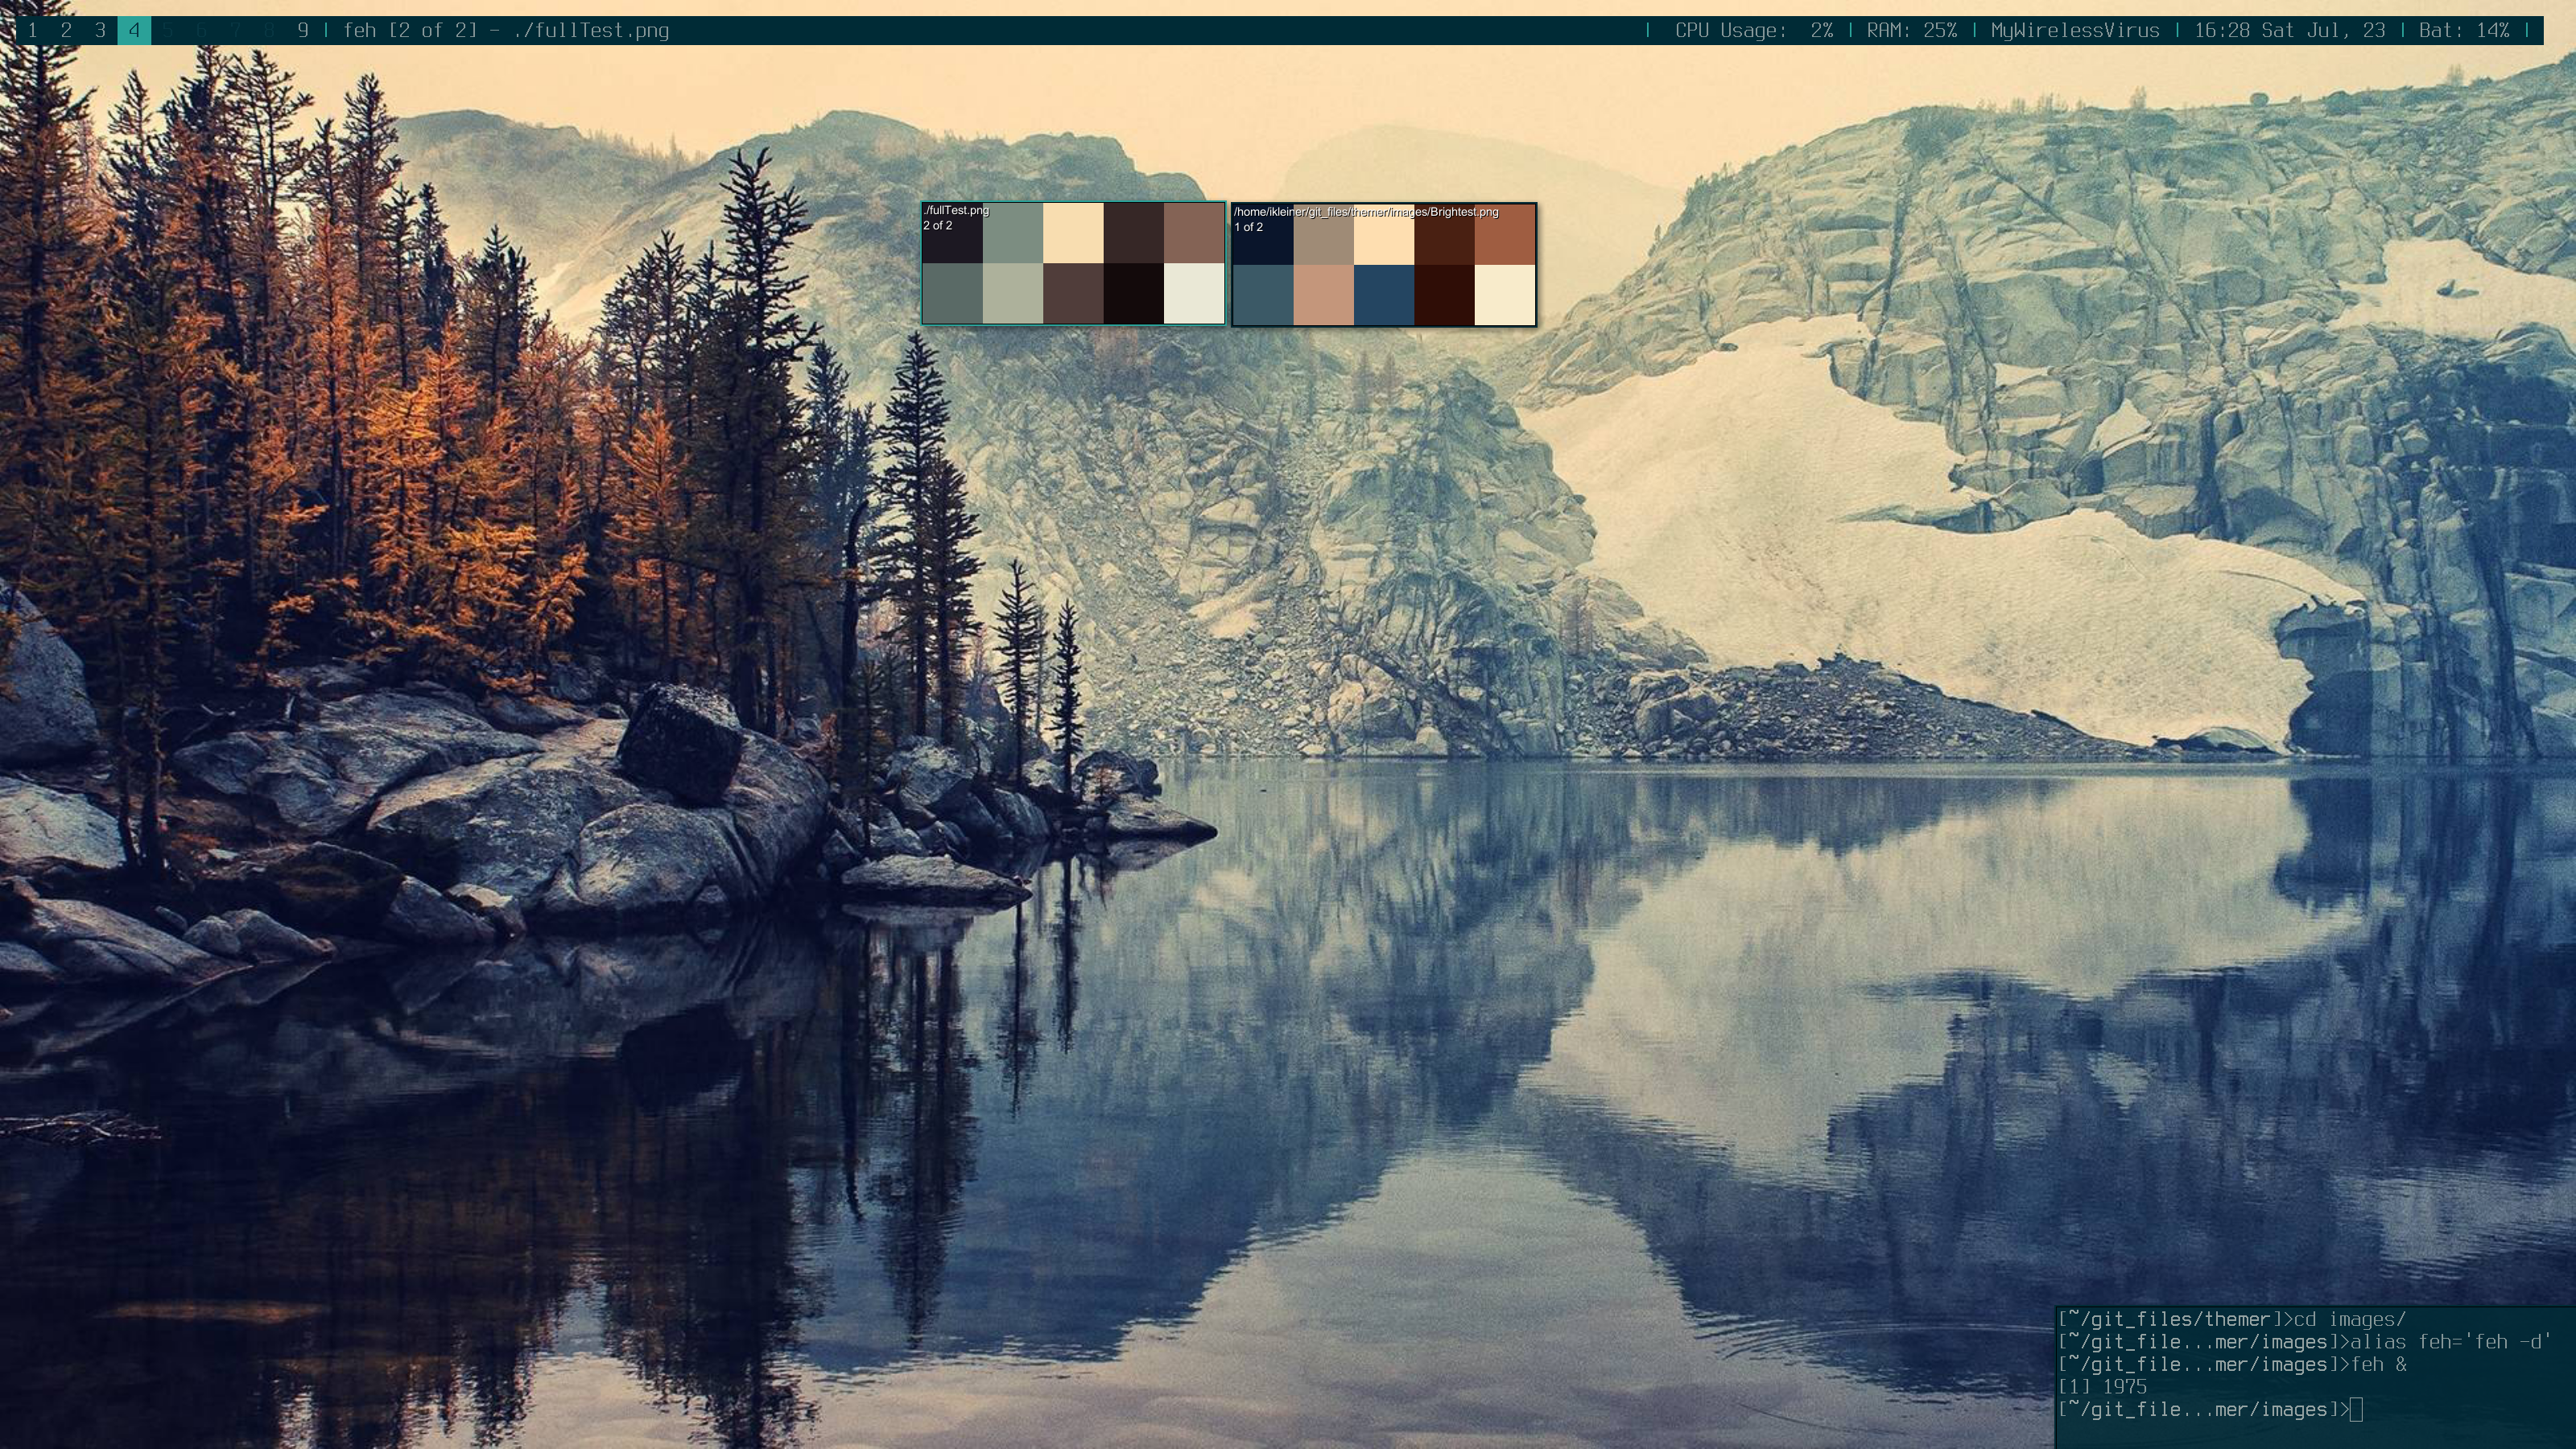
I called my idea for the brightening step, because that is what I was hoping it would do. If the clusters shown represent every color in the image, I could use those to get the bright colors back. First I go to each cluster and only grabbed it’s members (this is where the map would come in handy, which I have not implemented yet, so I just loop through and grab them just to see if it works). With this list of similar colors, I ran the whole process over again splitting this single group into k new groups. Out of these groups I threw all away except for the one that had the largest “spread.” Spread is currently defined as Max(R, G, B) - average(!Max(R, G, B)). I take the highest value and subtract the average of the other two. Obviously this is not the best way to do it, but I had been struggling to get the brighter colors out for hours, and it was very late. It will soon be changed to the difference between max and min, I just have not gotten around to it because I have been working on a few other projects. Hopefully I have it done soon. I also got very tired of seeing this image make me look a fool, so I moved on to some other images that would hopefully be easier. On the left is the initial colors, and the right is after the brightening step. The colors on the left are ordered by most member points from top to bottom, left to right. The right image retains this order, so color from the top left of brightened image was extracted from the color on top left of the original clusters image.
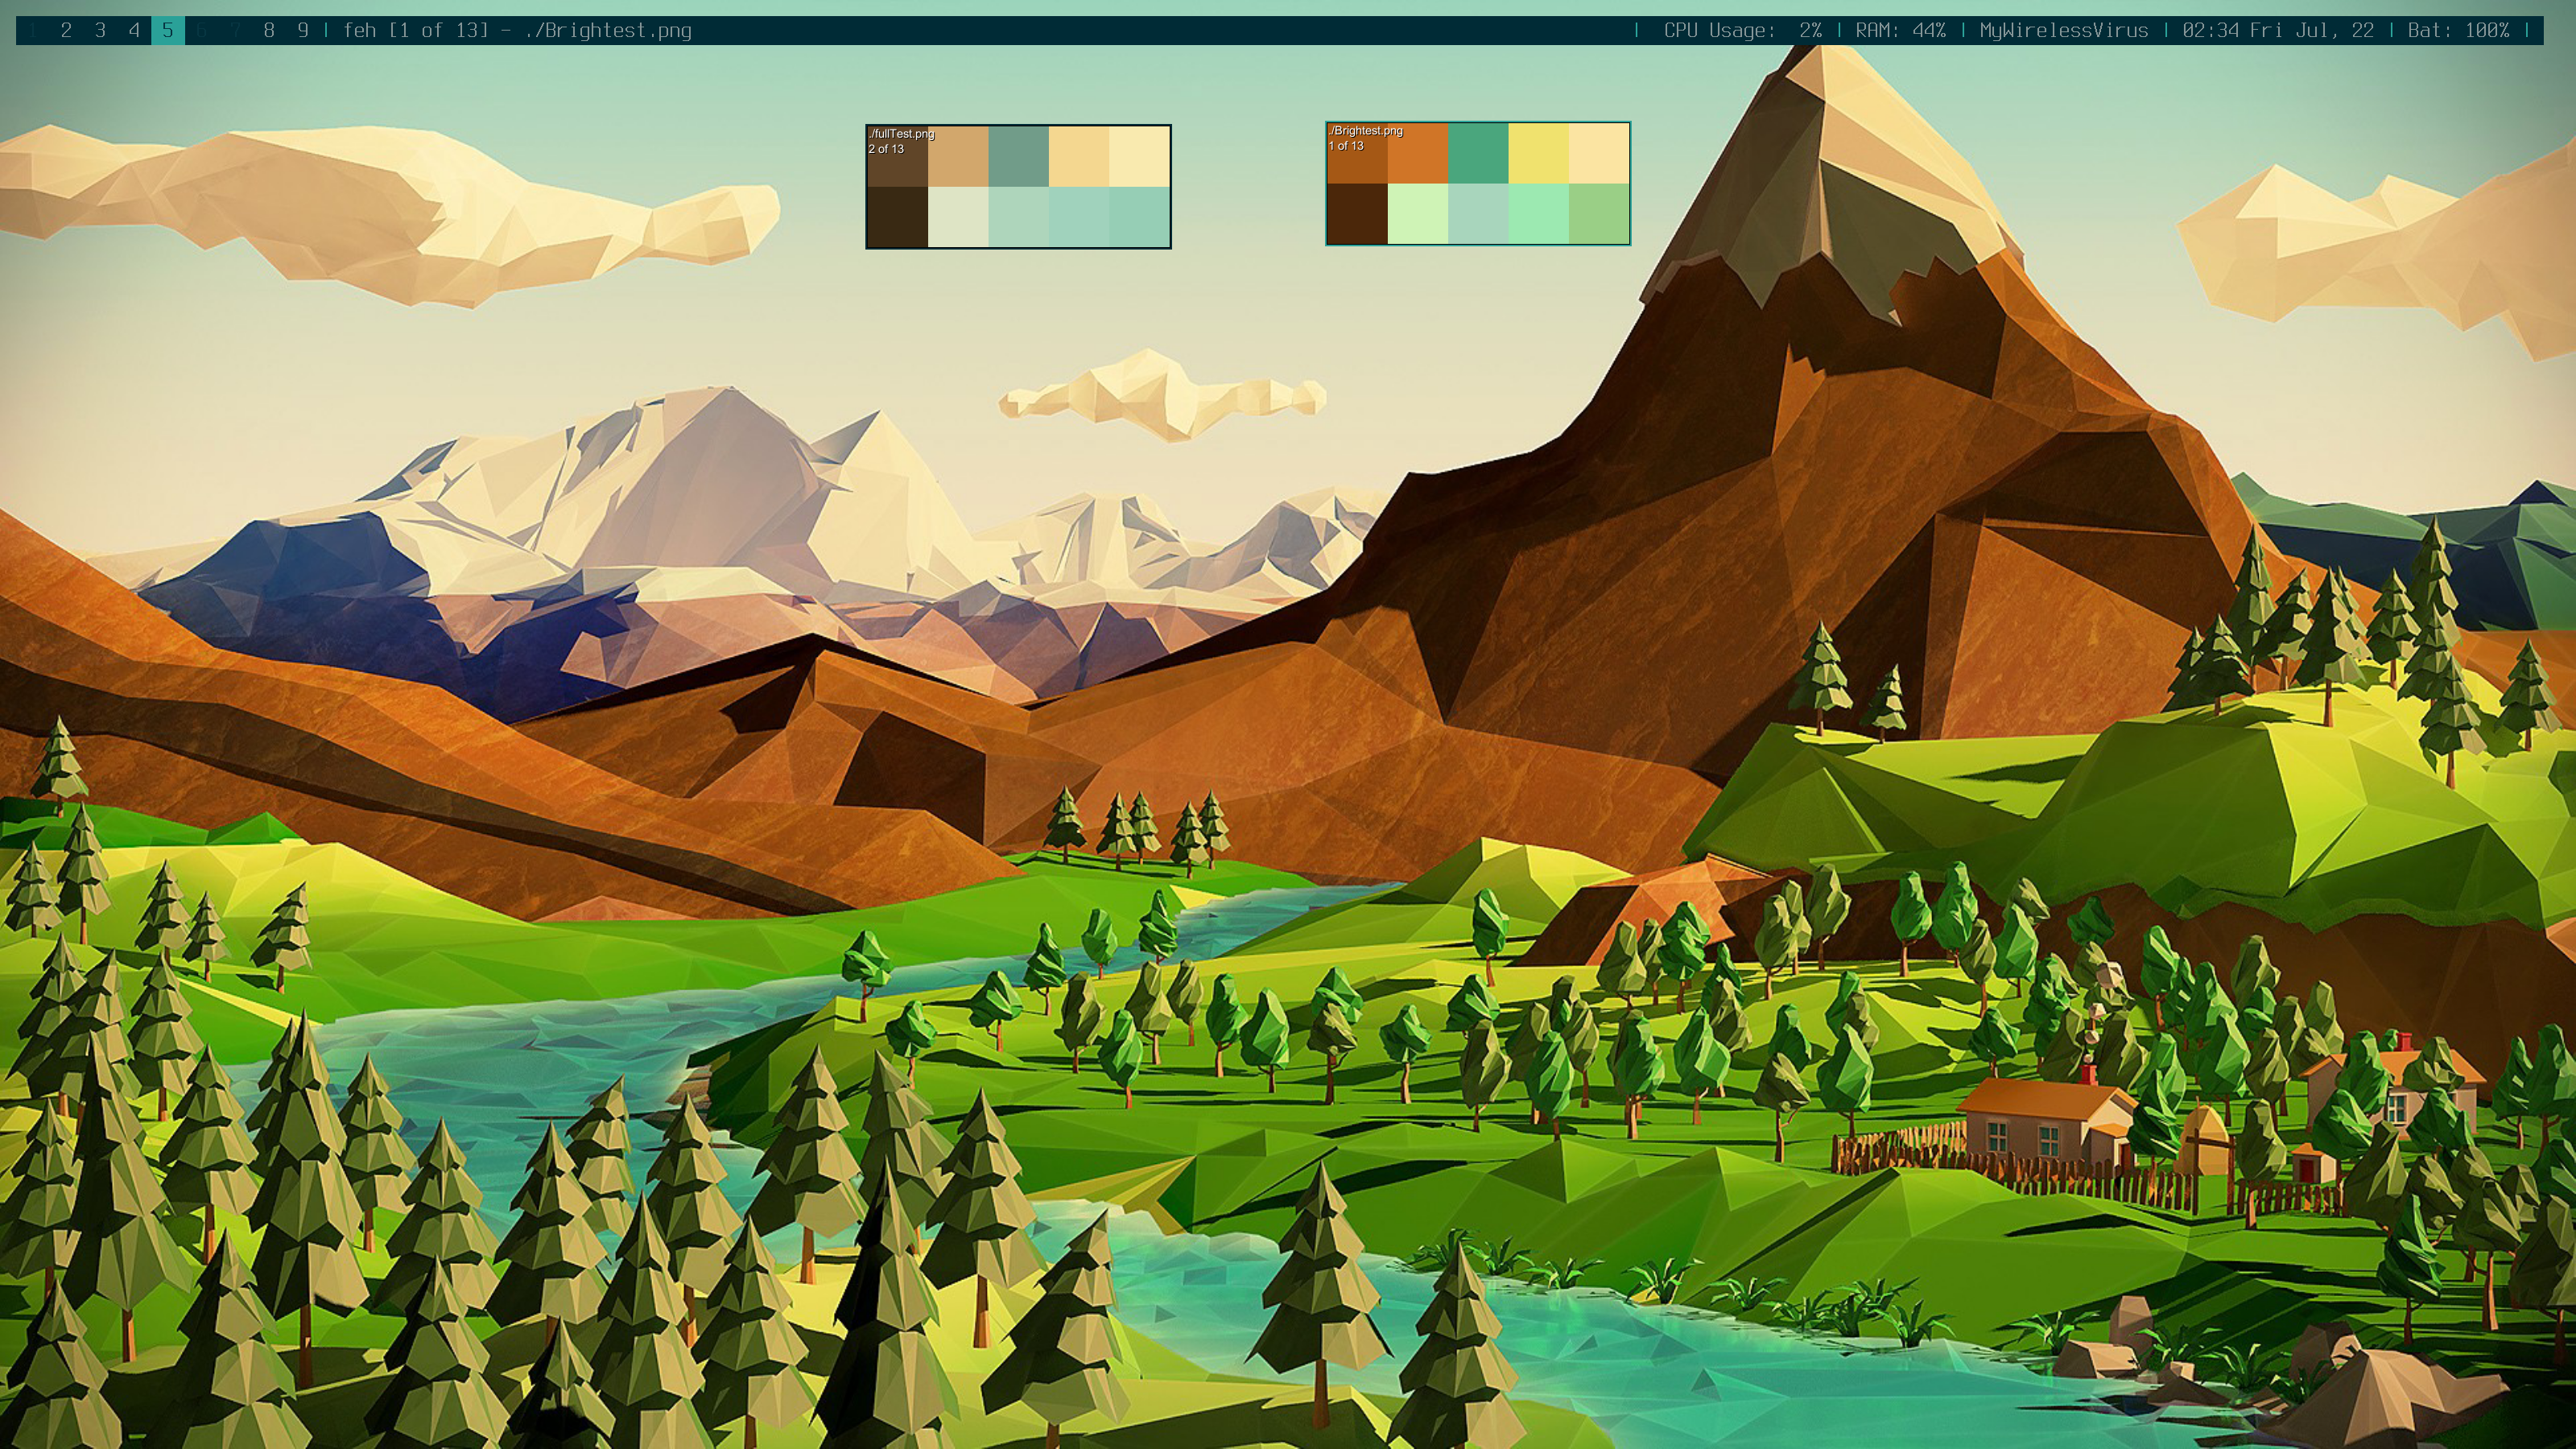
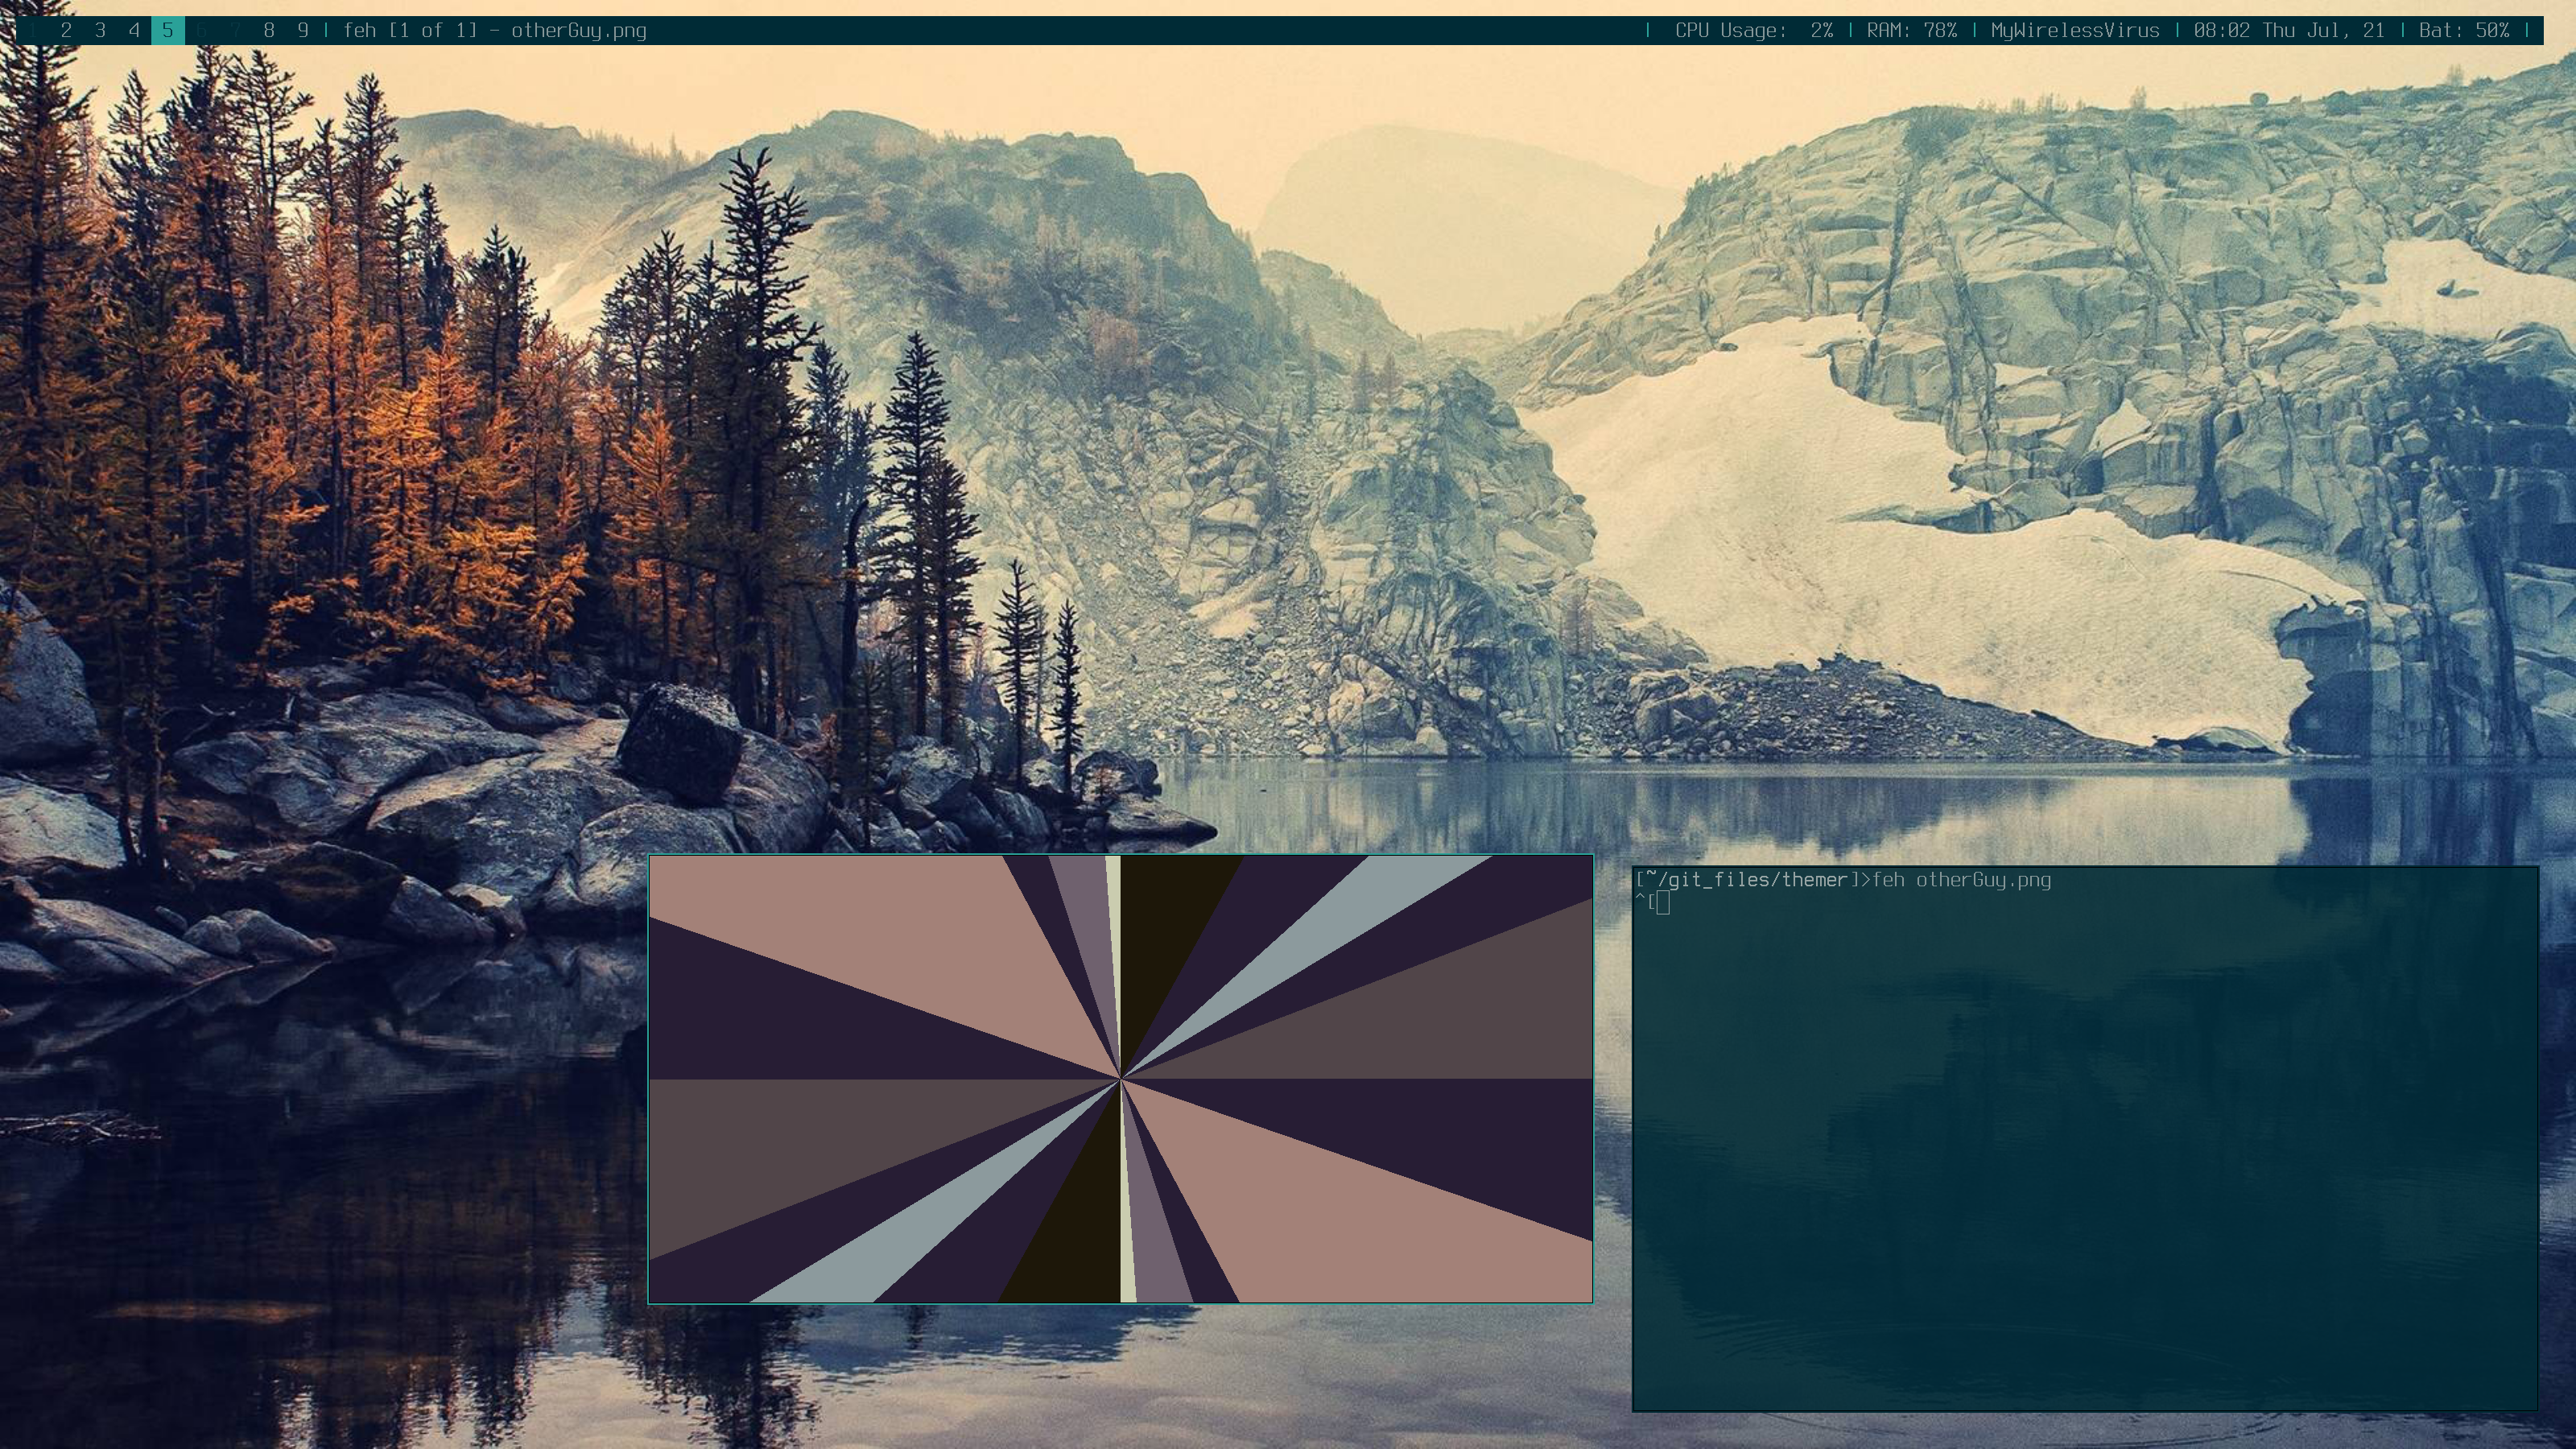
I was quite happy with the results, so I decided to go back and try the new process out on my old nemesis, the fall lake that had been tormenting me for ages.
DANG! I was so close too. These colors are definitely better, but still not what I was looking for. There is a simple fix, just brighten the already brightened colors.
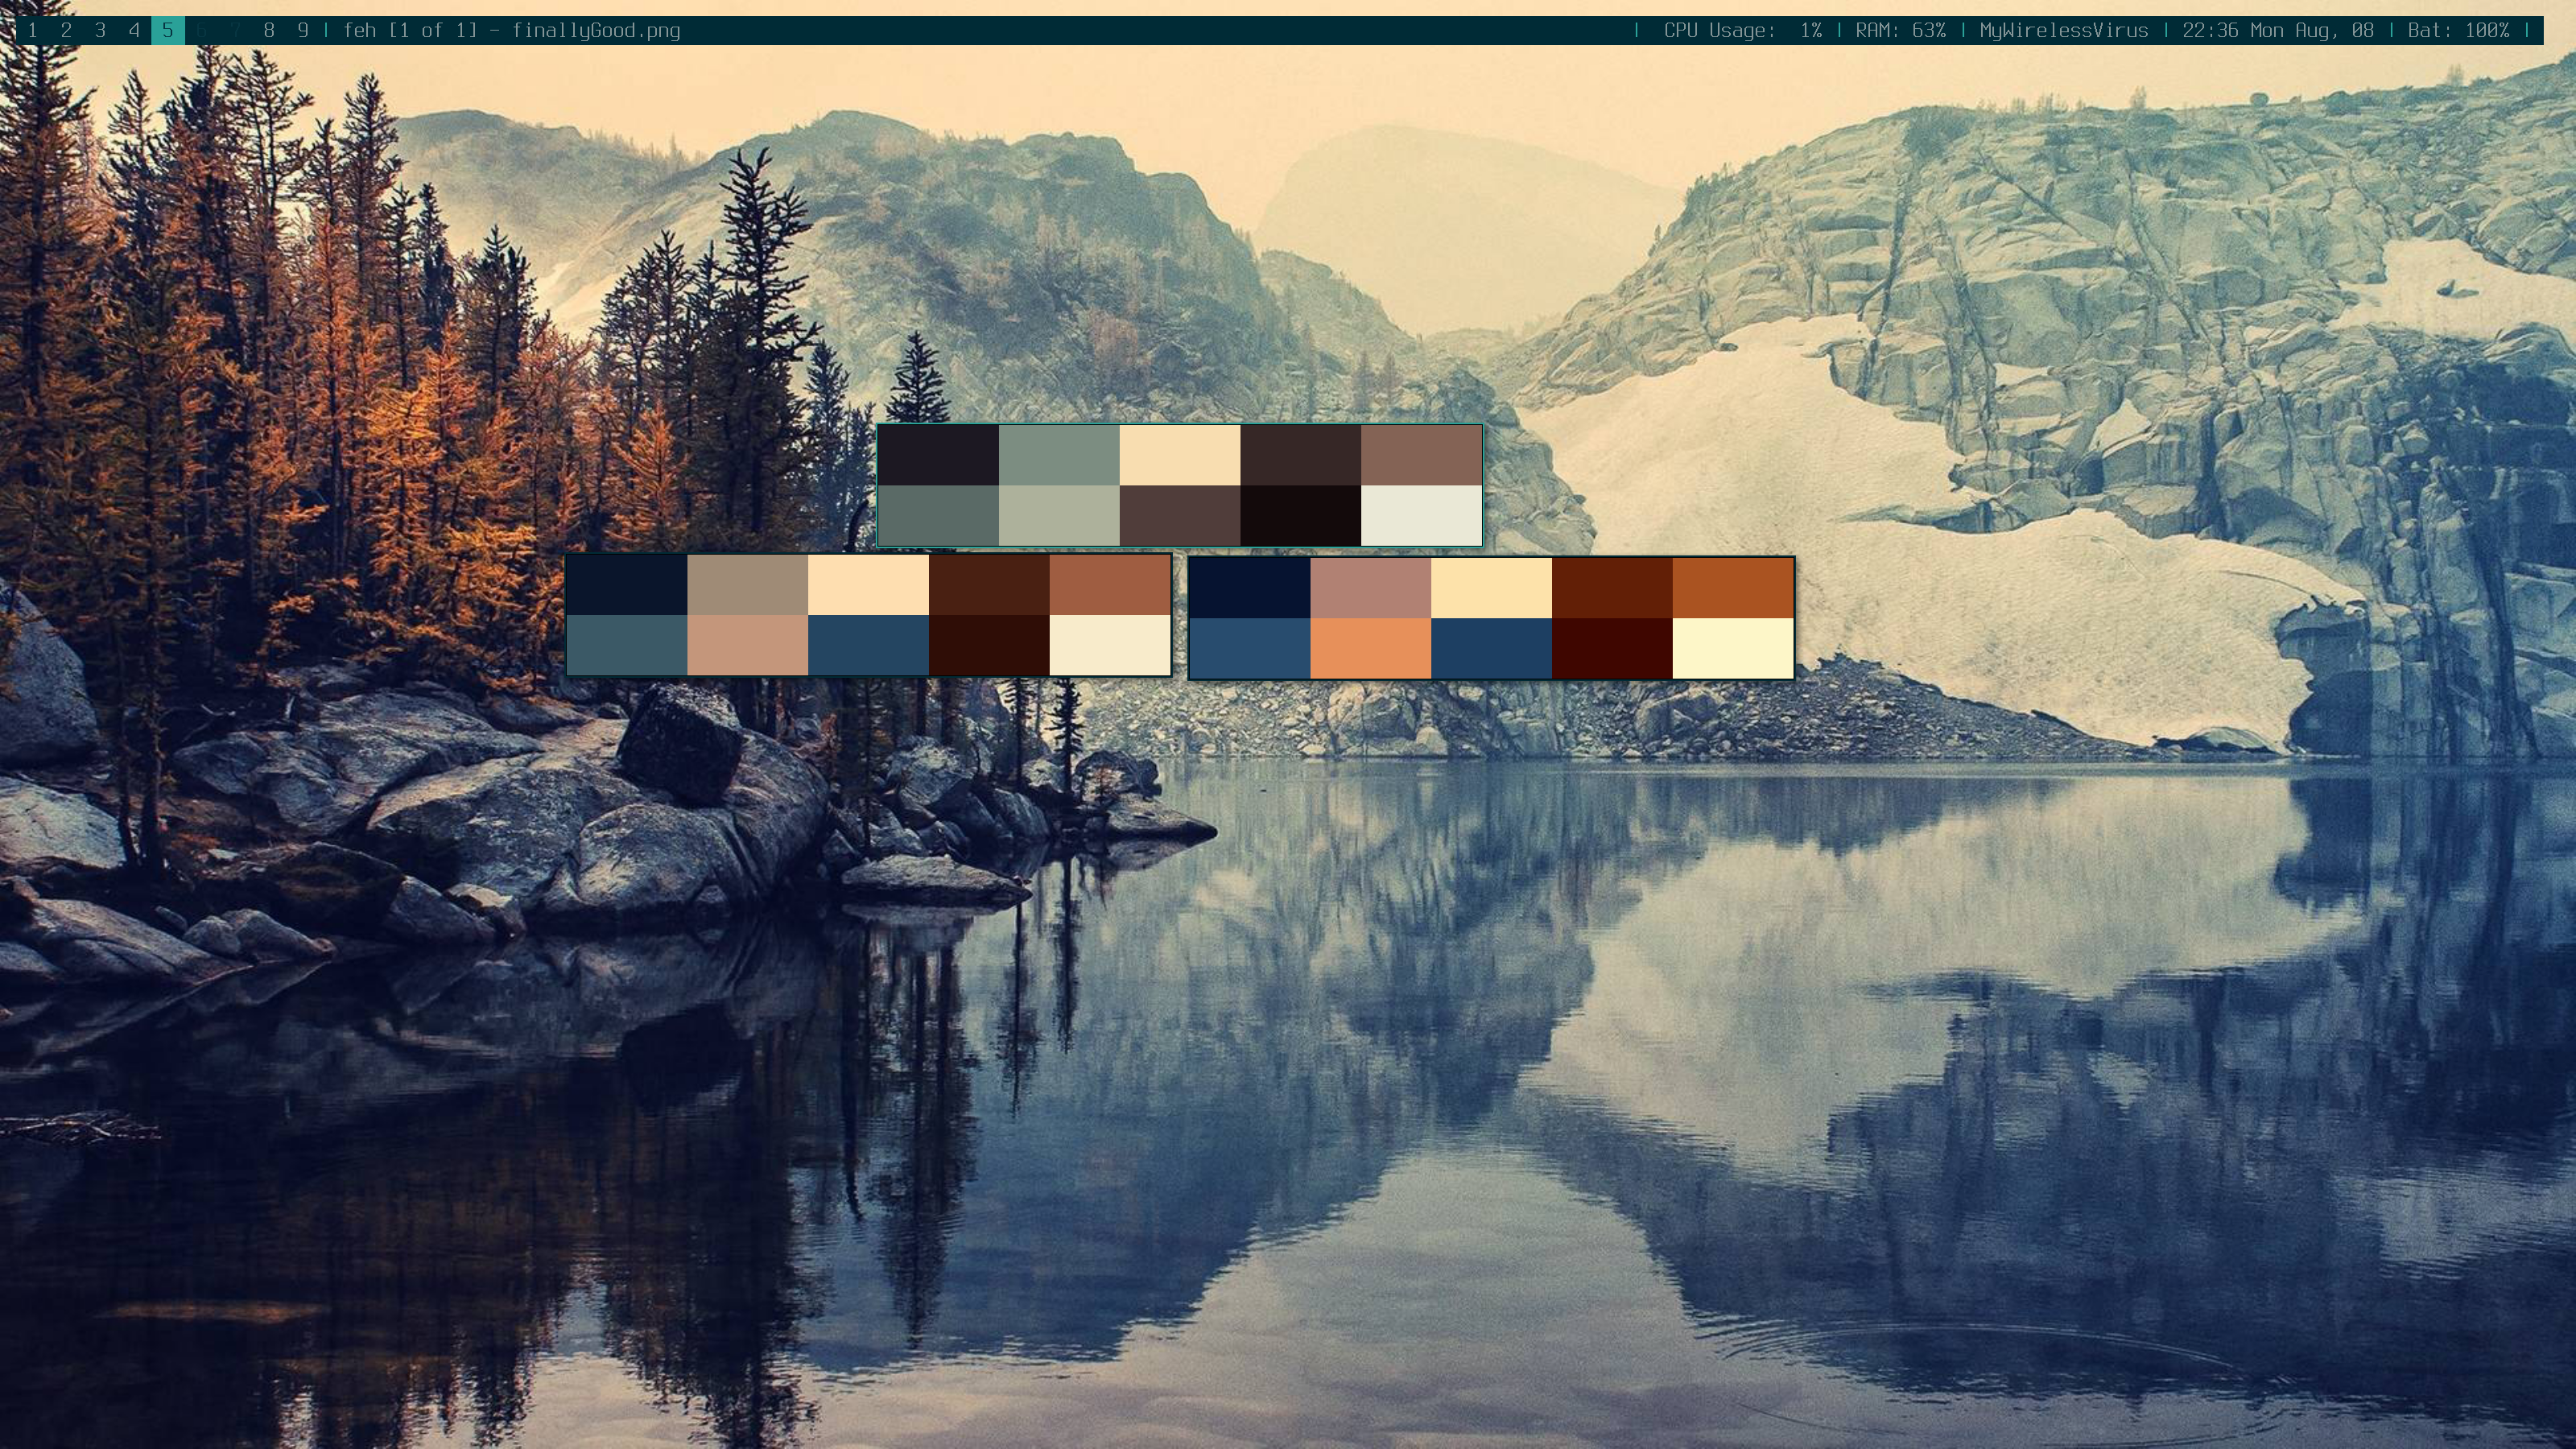
I still have not perfected it, and the project continues, but so far I really like what I have. I can mix and match the colors from different brightening steps as needed, but I would like to eventually find a way to get one output perfect. This program was much faster than some of the other programs that had good color extraction, but much slower than the ones with less perfect color extraction (like themer2, which is on average faster).
My program takes a few seconds which is not bad considering that not even one of the more than 2 million pixels is ignored. I have not added any optimizations yet, I plan to eventually add triangle inequality to avoid unnecessary distance calculations. I will also eventually try to add concurrency and parallelism because there is no restriction that we do the points one at a time or in any order. Concurrency has the added difference that depending on order that points are added we could take more or less iterations to complete a problem. The likelihood of this is low, and it will only be a very small number of iterations either way before convergence, it is just something to keep in mind.
The source for this project is available here.